
ICT killzones span a full 24-hour cycle. The Asian killzone runs 8:00 to 10:00 PM Eastern. London opens at 2:00 to 5:00 AM. New York activates at 7:00 to 10:00 AM. The Silver Bullet adds three more 1-hour windows scattered across the day. No single trader can monitor all of these manually and sleep.
This is not a latency problem. ICT entries are based on price structure at specific levels, not arbitrage. Sub-20 millisecond connectivity is more than sufficient. It is not primarily a CPU problem either, though CPU matters in bursts. The defining infrastructure challenge is that ICT strategies combine precise time-window scheduling with a resource pattern unlike any other EA workload: idle for 18 or more hours per day, then spiking to 80-100 percent CPU when multiple killzone EAs activate simultaneously during London or New York open, processing surging tick volume while scanning for order blocks, FVGs, and market structure shifts across multiple pairs.
Two additional complications make ICT automation uniquely VPS-dependent. DST transitions shift killzone boundaries by one hour, twice per year, with a 2 to 3 week gap when US and European clocks are out of sync. An EA using the wrong MQL5 time function will trade in the wrong killzone window during these periods without any error message. And ICT indicators generate 80 to 200 or more chart objects per chart (order blocks, FVG rectangles, liquidity lines, BOS/CHoCH labels, session boxes), creating a performance multiplier that standard “RAM per chart” sizing estimates do not account for.
This article covers the infrastructure side of automating ICT strategies on a VPS. It examines killzone timing with exact broker server time conversions, which MQL5 time functions are safe for session scheduling, how to handle DST transitions without breaking the EA, why the killzone burst pattern demands dedicated CPU cores, and how chart object density from ICT indicators affects long-term terminal stability. The focus is on keeping the automation running correctly at the right times, not on whether ICT methodology produces profitable trades.
Sources include MQL5 documentation and forum discussions, MQL5 Market product analysis, TradingView indicator implementations, ForexFactory community reports, ICT methodology references (innercircletrader.net, TradingRage, FXOpen), and VPS provider benchmarks. Commercially motivated sources are flagged where cited.
Killzone Times: The Canonical Reference and the Contradiction Problem
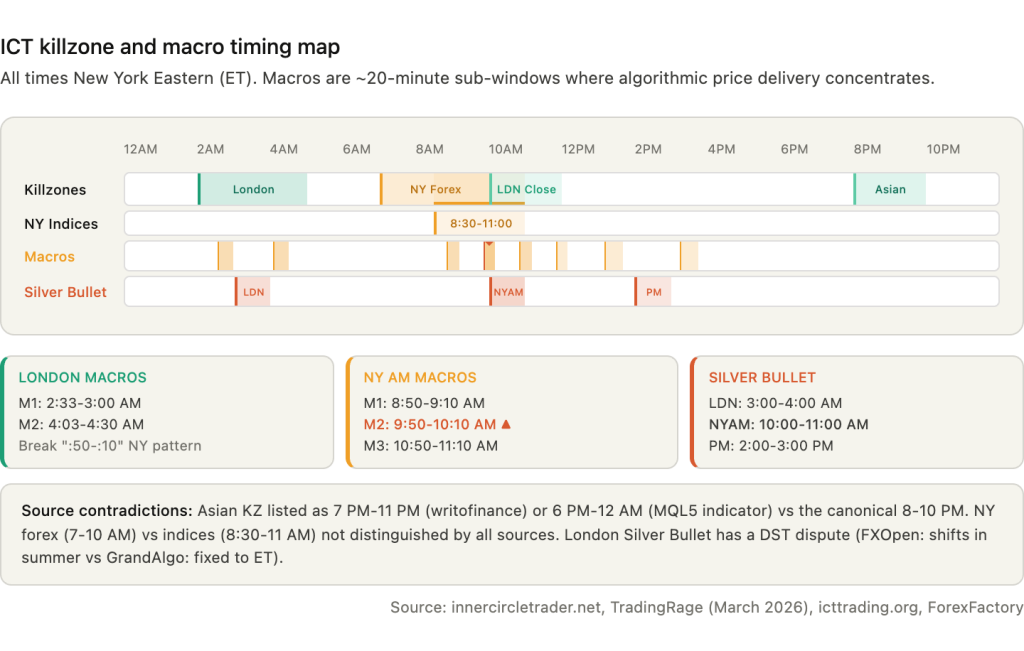
Every ICT killzone is anchored to New York local time. This is how Michael Huddleston (ICT) teaches the methodology, and it is the reference frame that all automation must use. The five canonical killzone windows, cross-referenced across TradingRage (updated March 2026), innercircletrader.net, icttrading.org, howtotrade.com, and multiple TradingView and MQL5 indicator implementations, are: Asian at 8:00 to 10:00 PM Eastern, London Open at 2:00 to 5:00 AM, New York forex at 7:00 to 10:00 AM, New York indices at 8:30 to 11:00 AM, and London Close at 10:00 AM to 12:00 PM.
These are not universally agreed upon. The Asian killzone is listed as 7:00 PM to 11:00 PM by writofinance.com and 6:00 PM to 12:00 AM by one MQL5 indicator. Both represent the broader Asian session rather than the narrower killzone. The New York window shows the widest variation: TradingRage distinguishes forex (7:00 to 10:00 AM) from indices (8:30 to 11:00 AM), while icttrading.org and howtotrade.com cite 8:00 to 11:00 AM without distinguishing asset class, and OpoFinance (a broker, commercially interested) cites 7:00 to 9:00 AM. An EA hardcoded to one source’s times will behave differently from an EA hardcoded to another’s. Configurable killzone parameters are not a convenience feature. They are a correctness requirement.
ICT macros are approximately 20-minute sub-windows within killzones where algorithmic price delivery concentrates. These were introduced in ICT’s 2023 Mentorship series and are cited nearly identically across TradingView indicators by reastruth, MarioLeb, and Anton_Zhezherun, ForexFactory thread 1342362, and innercircletrader.net. The eight primary macros are: London Macro 1 at 2:33 to 3:00 AM, London Macro 2 at 4:03 to 4:30 AM, NYAM Macro 1 at 8:50 to 9:10 AM, NYAM Macro 2 at 9:50 to 10:10 AM (considered the highest-probability window), NYAM Macro 3 at 10:50 to 11:10 AM, NY Lunch Macro at 11:50 AM to 12:10 PM, NY PM Macro at 1:10 to 1:40 PM, and NY Close Macro at 3:15 to 3:45 PM.
The London macros break the pattern that the New York macros follow. NY macros run on the “:50 to :10” boundary consistently. London Macro 1 starts at :33 and London Macro 2 starts at :03, with different durations. An EA implementing macros as a generic “start at :50, end at :10” rule will miss the London windows entirely.
The Silver Bullet is the most time-constrained ICT model: three specific 1-hour windows at London 3:00 to 4:00 AM, NYAM 10:00 to 11:00 AM, and NY PM 2:00 to 3:00 PM Eastern. The entry logic within each window is mechanical: identify a liquidity sweep, wait for an FVG to form, enter on the FVG retest. The NYAM window (10:00 to 11:00 AM) is considered the highest-probability due to London-New York overlap volume. FXOpen notes a DST variation for the London Silver Bullet, stating it shifts to 2:00 to 3:00 AM in summer, while GrandAlgo states the windows are “fixed” to ET and “do not shift with daylight saving.” This is a genuine contradiction between sources that the EA must resolve, and Section 4 covers the DST problem in detail.
For automation on a VPS, all of these times must be converted to broker server time. Most MT4/MT5 forex brokers use GMT+2 in winter and GMT+3 in summer to align the daily candle close with 5:00 PM Eastern. On a GMT+2/+3 broker, the Asian killzone maps to 3:00 to 5:00 AM server time (next day), London maps to 9:00 AM to 12:00 PM, and New York maps to 2:00 to 5:00 PM. These conversions hold stable because both the broker and the killzone reference move together on the US DST schedule. For GMT+0 brokers (fixed UTC), the conversion changes between EST and EDT periods. London killzone maps to 7:00 to 10:00 AM UTC in winter but 6:00 to 9:00 AM UTC in summer. An EA coded with fixed UTC offsets will trade in the wrong killzone windows during these transition periods.
MQL5 Time Functions: Which Ones Work for Killzone Detection
The choice of time function in an ICT EA determines whether killzone scheduling depends on broker connectivity or VPS clock accuracy. Using the wrong function does not produce an error. It produces trades at the wrong time, which is worse.
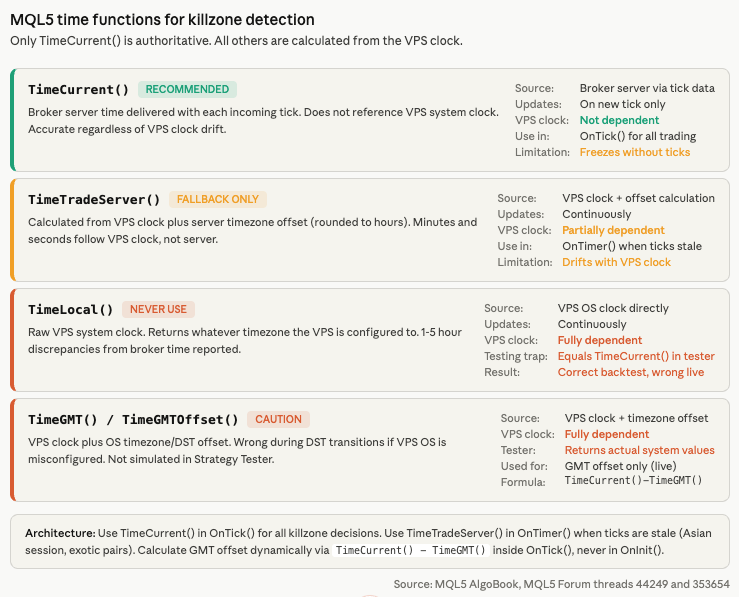
TimeCurrent() returns the last known broker server time, delivered with each incoming tick. It does not reference the VPS system clock at all. If the VPS clock drifts by five minutes, TimeCurrent() remains accurate because the value originates from the broker’s trade server. For killzone detection inside OnTick(), this is the correct primary time source. The limitation is that TimeCurrent() freezes between ticks. The MQL5 AlgoBook confirms: “If there are no ticks, the server time in the terminal stands still. This is especially noticeable on weekends and holidays.” During the Asian session on exotic pairs where ticks can arrive minutes apart, TimeCurrent() may report stale time. An EA checking whether the London killzone has started at 2:00 AM via OnTimer() will not see time advance if no ticks have arrived since 1:55 AM.
TimeTradeServer() attempts to provide continuous server time by calculating the timezone offset between client and server (rounded to whole hours) and adding it to the VPS local clock. The minutes and seconds come from the VPS, not the server. The MQL5 AlgoBook documents this explicitly: the function “will show the minutes and seconds of the client, not the server.” If the VPS clock drifts by 90 seconds, TimeTradeServer() drifts by 90 seconds. For macro-level precision where windows start at :33 or :50 past the hour, this drift can push entries outside the intended window. TimeTradeServer() serves as a useful fallback in OnTimer() when ticks are stale, but it should never be the sole time source for minute-precise scheduling.
TimeLocal() returns the raw VPS system clock. It reflects whatever timezone the VPS is configured to, regardless of broker server time. MQL5 forum users report consistent 1 to 5 hour discrepancies between VPS journal timestamps and broker order times. A forum post (thread 353654) states directly: “Your EA settings must be set at broker/server time, not MQL5 VPS time.” TimeLocal() should never appear in killzone detection logic. It has an additional testing trap: in the Strategy Tester, TimeLocal() always equals TimeCurrent(), meaning an EA that uses TimeLocal() for session filtering will produce correct backtests but incorrect live behavior.
TimeGMT() and TimeGMTOffset() both depend on the VPS operating system’s timezone and DST configuration. If the VPS OS is not properly configured for DST transitions, these functions report wrong GMT during the 2 to 3 week spring gap and the 1 week fall gap each year. Neither function is simulated in the Strategy Tester, making DST-dependent backtesting impossible without workarounds.
The recommended architecture for ICT EAs uses TimeCurrent() in OnTick() for all trading decisions, with TimeTradeServer() as a fallback in OnTimer() for low-liquidity periods. GMT offset is calculated dynamically inside OnTick() using gServerGmtOffset = (int)(TimeCurrent() – TimeGMT()). This calculation must not be performed in OnInit(), because at initialization there may be no broker connection and no chart data loaded yet, per MQL5 forum guidance. The critical principle from MQL5 forum thread 44249 and the MQL5 AlgoBook: all time functions except TimeCurrent() are calculated, not authoritative.
The canonical code pattern for killzone detection handles midnight-straddling sessions (required for the Asian killzone, which crosses midnight in broker server time):
bool IsInSession(int curHour, int curMin, int startHour, int startMin, int endHour, int endMin) {
int curTime = curHour * 60 + curMin;
int startTime = startHour * 60 + startMin;
int endTime = endHour * 60 + endMin;
if(startTime < endTime) return (curTime >= startTime && curTime < endTime);
else return (curTime >= startTime || curTime < endTime);
}
The else branch handles sessions that cross midnight. Without it, an EA checking whether 3:30 AM is between 20:00 and 05:00 returns false because 3:30 is less than 20:00. The midnight-straddling logic is not optional for ICT automation. Any EA that omits it will never activate the Asian killzone.
DST Transitions: The Silent EA-Killer
An ICT EA that works correctly for 48 weeks per year can fail silently during the four weeks when US and European DST transitions are out of sync. The EA enters trades during what it calculates as the London killzone, but the actual killzone started an hour earlier or has not started yet. No error is thrown. No warning appears. The trades simply occur at the wrong time.
US Daylight Saving Time begins on the second Sunday of March (spring forward) and ends on the first Sunday of November (fall back). European and UK DST begins on the last Sunday of March and ends on the last Sunday of October. The two schedules overlap for most of the year but diverge during two transition gaps.
The spring gap in 2026 runs from March 8 to March 29. The US moves clocks forward on March 8. Europe does not move until March 29. During these three weeks, the New York to London offset is 4 hours instead of the usual 5. A broker following US DST shifts from GMT+2 to GMT+3 on March 8, while a broker following EU DST remains at GMT+2 until March 29. An EA that calculates killzone times based on a fixed 5-hour NY-to-London offset will place London killzone boundaries one hour off during this gap. A ForexFactory thread on the “1M Price Action System” (page 209) documents this confusion directly: “Right now the times are 1 hour off still as NY changed clocks before Europe.”
The fall gap in 2026 runs from October 25 to November 1. Europe falls back on October 25. The US does not fall back until November 1. During this week, the same offset discrepancy occurs in reverse.
MetaTrader does not notify EAs programmatically when DST changes occur. Brokers typically announce the shift via the MT4/MT5 mailbox tab, which EAs cannot read. The EA must detect or anticipate the transition through its own logic.
Three approaches exist, each with trade-offs. Auto-detection calculates the GMT offset dynamically using TimeCurrent() – TimeGMT() on each tick. This adjusts automatically when the broker shifts server time. The limitation is that TimeGMT() depends on the VPS operating system’s DST configuration. If the VPS OS is set to a timezone that transitions on a different schedule than the broker, the calculated offset will be wrong during the gap weeks. Auto-detection also does not work in the Strategy Tester because TimeGMT() returns the actual VPS system value, not a simulated historical value.
Algorithmic DST rules encode the “second Sunday of March” and “first Sunday of November” logic directly in the EA code, computing the transition dates for any year. This approach requires no external updates and works in the Strategy Tester if coded correctly. The complexity is that US, EU, and Australian DST follow different rules, and an EA trading across multiple broker timezone conventions must implement all relevant rule sets.
Hardcoded DST tables store the specific transition dates for each year (2026: US forward March 8, EU forward March 29, EU back October 25, US back November 1). This is 100 percent predictable and works everywhere, including the Strategy Tester. The cost is periodic maintenance: the table must be updated before each year’s transitions.
The DealingWithTime library on MQL5 CodeBase (by gooly/amrali) handles US, EU, and Australian DST from 1975 through 2030 and is Strategy Tester compatible. Version 2.03 or later is required because a CopyTime() behavior change in MT5 broke the original implementation. For ICT EAs that must work correctly in both live trading and backtesting across DST boundaries, this library is the most practical solution.
The recommended architecture combines auto-detection for live trading with algorithmic rules or the DealingWithTime library for backtesting. The live path uses TimeCurrent() – TimeGMT() to calculate the current broker GMT offset, which adjusts automatically when the broker shifts server time. The backtest path uses the algorithmic DST rules to simulate the correct offset for historical dates. The EA selects the appropriate path by checking MQLInfoInteger(MQL_TESTER) at initialization.
The Silver Bullet DST controversy illustrates why this matters for specific ICT strategies. FXOpen states that the London Silver Bullet window shifts from 3:00-4:00 AM to 2:00-3:00 AM during summer DST. GrandAlgo states the windows are “fixed” to ET and “do not shift with daylight saving.” If the EA follows the ICT principle that all times anchor to New York local time, the ET times remain constant and the broker server time equivalent shifts when the broker changes its GMT offset. An EA using TimeCurrent() (broker server time) with dynamic offset calculation handles this correctly without any conditional DST logic in the killzone check itself. The offset calculation absorbs the shift.
The Killzone Burst Problem: Why ICT Needs Dedicated CPU
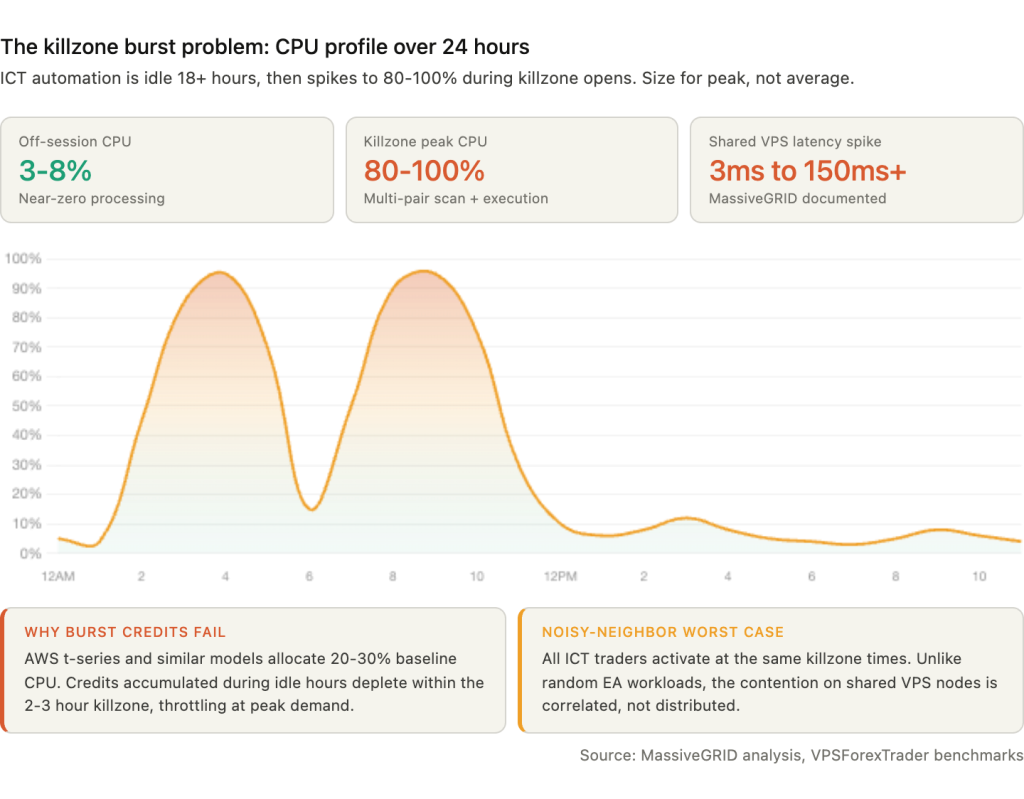
Most EA workloads have a roughly constant resource profile. A trend-following EA on EURUSD consumes similar CPU at 3 AM as it does at 10 AM. ICT automation does not. It is idle for 18 or more hours per day, then demands peak CPU during 2 to 3 hour killzone windows when tick volume surges, multiple EAs activate simultaneously, and all ICT indicators recalculate on every incoming tick.
At London open (2:00 to 5:00 AM Eastern) and New York open (7:00 to 10:00 AM), several things happen at once. Every killzone EA across all monitored pairs activates. ICT indicators begin scanning for FVGs, order blocks, and market structure shifts during the highest-volatility conditions of the day. Tick volume spikes 5 to 10 times above baseline, and each tick triggers recalculation of all chart objects. Multiple EAs may attempt to place orders simultaneously. CPU can spike from under 10 percent to 80 to 100 percent during these windows.
MassiveGRID’s analysis describes the shared VPS dimension of this problem: “Every EA on every VPS on the same host node begins processing tick data at accelerated rates” during major sessions. On shared VPS infrastructure, this produces “execution times that vary wildly (e.g., 3ms normally but 150ms+ during London or NY session opens).” ICT traders face the worst-case variant of this problem because all ICT traders activate at the same killzone times and react to the same 8:30 AM news releases. The noisy-neighbor effect is correlated rather than random.
AWS t-series instances and similar burst-credit CPU models are specifically problematic for this workload. They allocate a baseline CPU percentage (often 20 to 30 percent of a core) and accumulate credits during idle periods that can be spent during bursts. An ICT EA that idles for 18 hours builds substantial credits. But if the killzone burst lasts 2 to 3 hours and the credits deplete, the instance throttles to baseline right when the EA needs peak performance. The throttling happens silently. The EA continues running but processes ticks slowly enough that entries execute at degraded prices or miss windows entirely.
The ICT methodology’s Power of Three framework (Accumulation, Manipulation, Distribution) creates sub-phases within each killzone that demand different resource levels. During Accumulation in the early killzone, the EA monitors range formation with light CPU load. During Manipulation, the Judas Swing phase, the EA must process fast tick data to distinguish false breakouts from genuine displacement. This is the peak processing demand. During Distribution, the actual directional move executes and the EA may submit orders across multiple pairs simultaneously. The resource profile changes within a single 3-hour window, making simple “average CPU” metrics misleading for sizing.
MT4’s single trade context compounds the burst problem. If a London killzone EA on EURUSD calls OrderSend() at the same moment as an EA on GBPUSD, one receives Error 146 (“Trade Context Busy”) and must retry. During fast killzone moves, this queuing can cause multi-pip slippage on the second and third pairs. MT5 supports 8 parallel trade contexts natively, allowing all pairs to execute simultaneously. For ICT automation running across multiple pairs during the same killzone, MT5 eliminates this bottleneck. The MT4 mitigation is running separate terminal instances, each with its own trade context, at the cost of additional RAM.
The sizing implication is clear. ICT automation must be provisioned for peak killzone load, not average daily load. Dedicated vCPU cores (not shared, not burst-credit) are essential. CPU clock speed matters more than core count because MetaTrader is largely single-threaded; 3.5 GHz or higher sustained frequency is preferred. A VPS that reports 4 vCPU but throttles during contention is worse for ICT than a VPS with 2 dedicated cores that sustain full speed under load.
Chart Object Density: The ICT-Specific Performance Multiplier
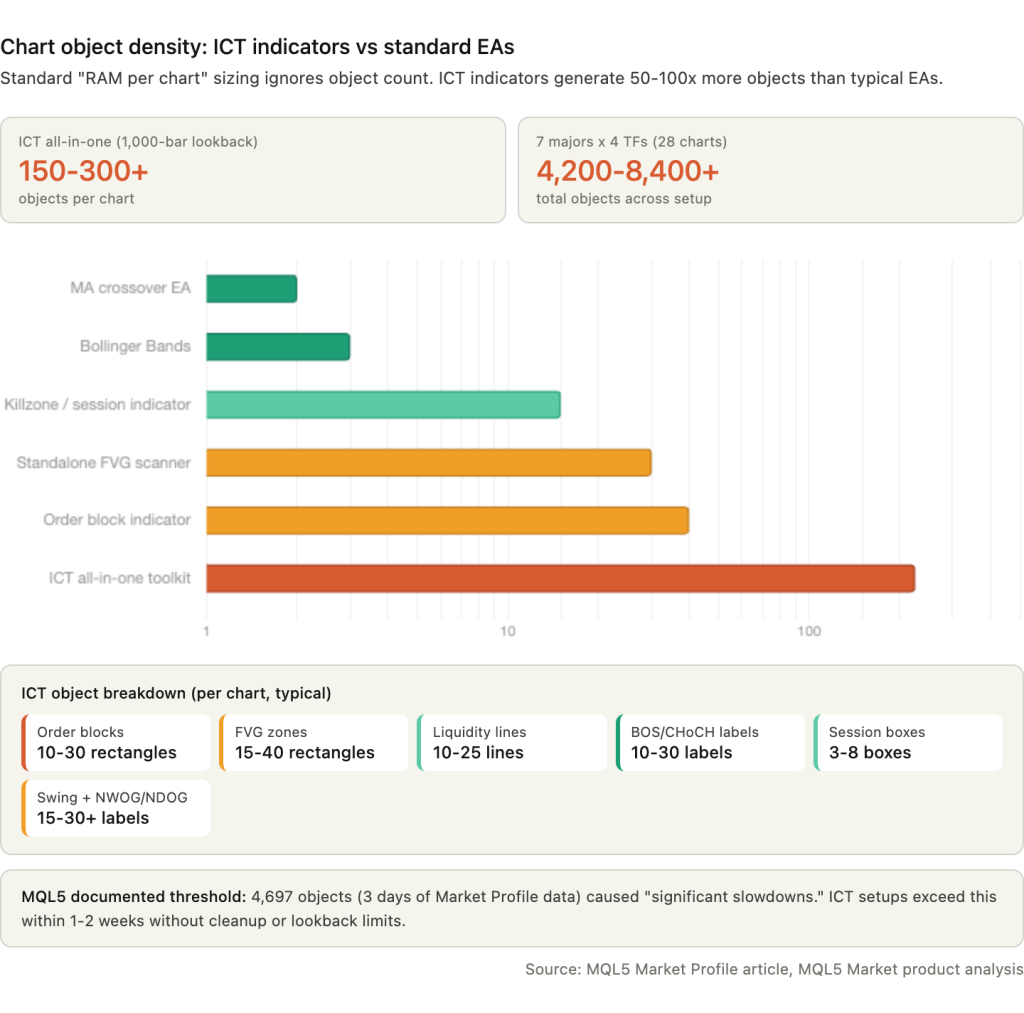
A moving average crossover EA creates two indicator lines per chart. A Bollinger Band EA creates three. An all-in-one ICT indicator creates 80 to 200 or more discrete chart objects per chart: 10 to 30 order block rectangles, 15 to 40 FVG rectangles, 10 to 25 liquidity level lines, 10 to 30 BOS and CHoCH labels, 3 to 8 session highlight boxes, 15 to 30 swing point labels, plus NWOG/NDOG zones and Premium/Discount zone overlays. With a default lookback of 1,000 bars, a product like Smart Market Structure Concepts can generate 150 to 300 or more chart objects on a single chart.
Standard VPS sizing estimates use “RAM per chart” as the unit of measurement. For ICT, the relevant unit is objects per chart multiplied by charts per pair multiplied by pairs monitored. A trader running 7 majors across 4 timeframes with a comprehensive ICT indicator is not running 28 charts. They are running 28 charts carrying 4,200 to 8,400 or more chart objects collectively.
MetaTrader was not designed for this object density. An MQL5 article on Market Profile optimization documents that creating 4,697 rectangular graphical objects for just 3 days of data caused “significant slowdowns.” Each chart redraw iterates through every object to determine visibility and rendering parameters. A user of the free “Supply and Demand Order Blocks MT5” indicator on MQL5 Market reported the terminal becoming “very slow/laggy,” confirming real-world performance degradation from ICT-style chart objects.
The degradation is progressive and silent. At 500 objects per chart, performance is normal. At 2,000 to 3,000, chart scrolling slows noticeably. At 5,000 or more, switching timeframes or symbols can freeze the terminal for several seconds. On a VPS running unattended during a killzone, this freeze occurs precisely when tick processing speed matters most.
Five mitigations reduce the impact without abandoning ICT indicators. Reducing “Max bars in chart” from the default 100,000 or more to 1,000 to 5,000 dramatically cuts the number of historical zones the indicator draws. The lookback period produces the largest object count reduction per setting change. Limiting the historical display of FVGs and order blocks through indicator parameters (most commercial ICT tools expose a maximum-zones setting) caps the visible object count regardless of lookback depth. Disabling chart rendering on the VPS (unchecking “Show OHLC” and “Show trade levels” in chart properties) saves CPU cycles on visual updates that nobody is watching. Hiding unused symbols from Market Watch reduces tick processing load, which means fewer recalculations of all those objects per second. And some indicators use CCanvas bitmap rendering instead of individual graphical objects, drawing zones directly onto a canvas overlay. This approach eliminates the per-object redraw overhead entirely. Products that mention CCanvas in their descriptions are worth prioritizing for VPS deployment.
The practical test is simple. After deploying an ICT indicator on the VPS, open Task Manager and watch CPU during a killzone. If CPU spikes above 80 percent with the indicator loaded but stays below 30 percent with the indicator removed on the same charts, the object density is the bottleneck. Reduce lookback or switch to a lighter product before the terminal freezes during a live session.
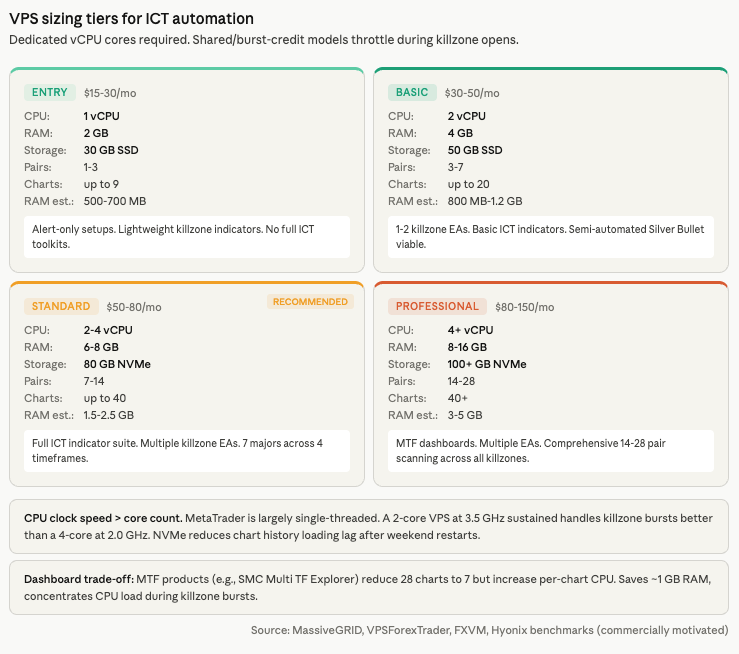
VPS Sizing for ICT Automation
ICT automation requires sizing for peak killzone load, not average daily load. A VPS that handles 7 pairs comfortably at 2 PM when nothing is active may freeze at 2:05 AM when London opens and every indicator recalculates on surging tick volume across all charts simultaneously. The tier recommendations below assume dedicated CPU cores, not shared or burst-credit allocations.
The RAM equation starts with chart count, but chart count alone understates the requirement. A minimal setup running 1 pair across 3 timeframes (M5, H1, H4) produces 3 charts consuming approximately 500 to 700 MB on MT5 including the terminal baseline. A basic setup with 3 pairs across 3 timeframes produces 9 charts at 800 MB to 1.2 GB. The standard configuration of 7 majors across 4 timeframes (M5, M15, H1, H4) produces 28 charts at 1.5 to 2.5 GB. A comprehensive setup with 14 pairs across 4 timeframes produces 56 charts at 3 to 5 GB. These figures assume optimized max bars settings and do not include the additional overhead from ICT indicator chart objects, which can add 20 to 40 percent to the per-chart memory footprint depending on indicator complexity and lookback depth.
The multi-timeframe dashboard approach trades chart count for CPU load. Products like SMC Multi TF Explorer run on a single chart per pair and query multiple timeframes internally via CopyRates(). This reduces a 28-chart setup to 7 charts, saving roughly 1 GB of RAM. The trade-off is that a single chart running multi-timeframe queries consumes significantly more CPU per chart than a simple single-timeframe chart, because each tick triggers recalculation across all queried timeframes. During killzone bursts, this concentrated CPU load can spike higher on fewer charts than the distributed load across many charts.
Four tiers cover the range of ICT automation deployments. The entry tier at 1 vCPU and 2 GB RAM with 30 GB SSD handles 1 to 3 pairs with basic ICT indicators on 9 or fewer charts, suitable for alert-only setups at approximately $15 to $30 per month. The basic tier at 2 vCPU and 4 GB RAM with 50 GB SSD handles 3 to 7 pairs with 1 to 2 killzone EAs on 20 or fewer charts at $30 to $50 per month. The standard tier, which is the recommended starting point for most ICT automation, provides 2 to 4 vCPU and 6 to 8 GB RAM with 80 GB NVMe, handling 7 to 14 pairs with a full ICT indicator suite on up to 40 charts at $50 to $80 per month. The professional tier at 4 or more vCPU and 8 to 16 GB RAM with 100 or more GB NVMe handles 14 to 28 pairs with multi-timeframe dashboards and multiple EAs at $80 to $150 per month.
Three VPS selection criteria matter more for ICT than for generic EA hosting. CPU clock speed outweighs core count because MetaTrader is largely single-threaded. A 2-core VPS at 3.5 GHz sustained handles killzone bursts better than a 4-core at 2.0 GHz. Dedicated vCPU is essential rather than optional. Shared CPUs throttle during high-volatility sessions, which is exactly when ICT EAs need peak performance. NVMe storage reduces history data loading lag when the terminal restarts or when an indicator re-scans after a profile switch. SATA SSD adds seconds to operations that NVMe completes in milliseconds, and those seconds compound across 28 charts loading simultaneously after a weekend restart.
VPS location should be near the broker’s execution hub (Equinix NY4 or LD4), not near the trader’s home. For ICT specifically, sub-20 millisecond latency is sufficient. The value of colocation for ICT is not sub-millisecond fills. It is consistent, low-jitter connectivity during the killzone burst when network quality matters most.
The ICT Tool Ecosystem on MQL5
The MQL5 Market contains dozens of ICT and SMC products ranging from free session indicators to comprehensive paid toolkits that combine order blocks, FVGs, BOS/CHoCH, liquidity levels, killzones, macros, and Silver Bullet windows in a single indicator. The choice of product determines the chart object density from Section 6, the CPU profile during killzone bursts from Section 5, and whether automated execution is possible or limited to alerts.
The most widely adopted all-in-one toolkit is Smart Market Structure Concepts by Jing Bo Wu. Priced at $49 for MT5, it carries a 4.63 out of 5 rating from 104 reviews with 8,789 demo downloads. It covers BOS/CHoCH, order blocks, FVGs, IFVGs, Premium/Discount zones, liquidity levels, a multi-timeframe dashboard, session highlighting, Asian range, and NWOG/NDOG zones. This is the product most likely to generate the 150 to 300+ chart object density described in Section 6, because it draws every ICT concept simultaneously.
ICT Template by David Perk ($30, MT4, 4.79/5 from 69 reviews) takes a different approach. Used daily by over 500 traders, it focuses on sessions, killzones, FVGs with multi-timeframe support, CBDR, ICT Macros, institutional levels, and hotkey drawing tools. The hotkey drawing feature is notable for VPS use: it enables rapid manual markup during RDP sessions rather than requiring an always-running indicator to draw everything automatically.
For killzone-specific automation, ICT Killzones and Macros by Barend Stander ($30 for MT5, $32 for MT4) covers all killzone windows and macros with output to the Data Window for EA integration on M1 charts. This Data Window output is the critical feature for developers building killzone-triggered EAs, because it allows a separate EA to read the killzone state without reimplementing the time calculation logic.
Simple ICT Concepts by Cao Minh Quang ($49, MT5) offers a different integration path. It exports order block and FVG price levels via MetaTrader’s Global Variables, which any EA can read via GlobalVariableGet(). This decouples detection from execution: the indicator identifies levels, the EA reads them and manages orders. For VPS deployments, this separation means the indicator can be swapped or updated without modifying the trading EA.
Free options exist for traders testing ICT automation before committing to paid tools. Trading Session ICT KillZone (free, MT5 and MT4) draws customizable Asia, London, and New York session zones. Sessions Killzone (free, MT5) adds daily range-adjusted visualization. These are lightweight enough for entry-tier VPS deployments but lack multi-timeframe scanning, macro windows, and alert integration.
One pattern is consistent across the ecosystem: no product discusses VPS resource consumption, chart object management, or killzone burst optimization in its marketplace description. The focus is entirely on trading features. The automation spectrum runs from alert-only setups (the indicator runs and sends push notifications, the trader decides manually, requiring approximately 512 MB RAM and 1 vCPU) through semi-automated (the EA identifies setups during killzones and places pending orders at OTE zones for the trader to approve via mobile, requiring approximately 1 GB and 1 to 2 vCPU) to fully automated (autonomous operation requiring 2 to 4 GB and 2 or more dedicated vCPU cores). Most ICT practitioners operate in the alert-only or semi-automated range, because the discretionary elements of the methodology (liquidity narrative, order block “quality” assessment, higher-timeframe bias) resist mechanical definition.
Practical VPS Setup for ICT Automation
ICT automation involves more charts, more indicators, and more time-sensitive scheduling than a typical EA deployment. The setup decisions made before the first killzone activates determine whether the system runs cleanly for months or requires intervention every week.
MetaTrader’s Profiles feature (File, Profiles, Save As) is the organizational foundation for ICT trading on a VPS. A profile saves the complete chart layout: which symbols are open, on which timeframes, with which templates applied, and in which arrangement. Three profiles cover the typical ICT workflow. An HTF Analysis profile loads daily charts of primary pairs with clean candlesticks, weekly and daily order blocks, and higher-timeframe FVGs for determining directional bias. An LTF Execution profile loads M15 and M5 charts with session indicators, killzone highlighting, FVG and order block indicators, and market structure shift markers for active killzone monitoring. A Scanner profile loads H1 charts of 6 to 8 pairs with simplified views showing session ranges and daily levels for quick assessment at killzone start. Switching between profiles restores the full workspace in seconds rather than the 30 or more minutes it would take to manually reconfigure 20 to 40 charts.
Templates (.TPL files stored in MQL5/Profiles/Templates/) save chart type, colors, indicators, EAs, and graphical objects, but not the timeframe or symbol. Configure one chart with the full ICT indicator stack and all parameters set, save it as a template, and apply it across all symbols. This ensures consistent indicator settings on every pair and reduces configuration errors.
Push notifications for killzone alerts use MetaTrader’s built-in system. Install the MT4/MT5 mobile app, navigate to Settings, Messages, and copy the 8-character MetaQuotes ID. On the VPS terminal, enter the ID under Tools, Options, Notifications and send a test. In EA code, SendNotification() triggers alerts at killzone start, macro windows, or when the EA detects a setup. The maximum is 160 characters per notification on MT4 and 255 on MT5. Push notifications only send while the desktop terminal is running and connected, which is the direct VPS dependency that makes 24/5 uptime essential for alert-only ICT setups.
For traders running both manual analysis and automated execution on the same VPS, separate MT5 installations in different directories isolate the two workflows. The execution instance runs minimized with no manual interaction. The analysis instance stays open for discretionary markup via RDP. Each MT5 instance consumes 300 to 800 MB RAM depending on chart count and indicator load.
Weekend gap handling requires specific ICT safeguards. Forex reopens at 5:00 PM Eastern on Sunday. Spreads widen sharply at the weekly open, and pending orders placed before Friday close may execute at unfavorable gap prices. Two automated safeguards address this: a spread filter that rejects entries when the spread exceeds a configurable multiple of normal (e.g., if(spread > maxAllowedSpread) return;) and a Friday cleanup routine that cancels open pending orders before market close to prevent unintended gap fills on Sunday.
Schedule Windows Updates exclusively on weekends via Group Policy to prevent mid-session reboots. The gpedit.msc path (Computer Configuration, Administrative Templates, Windows Components, Windows Update) should set automatic updates to “Notify to install and notify to reboot” at minimum. Disable auto-reboot entirely if possible and apply updates manually during the Saturday market close.
FAQ
Which ICT strategy is easiest to automate on a VPS?
The Silver Bullet. It operates within three rigid 1-hour windows (London 3:00-4:00 AM, NYAM 10:00-11:00 AM, NY PM 2:00-3:00 PM Eastern), and the entry logic is mechanical: identify a liquidity sweep, wait for an FVG to form, enter on the FVG retest. The fixed time windows reduce the scheduling problem to three simple IsInSession() checks. The mechanical rules reduce the detection problem to pattern matching on completed candles. Backtested win rates of 60 to 75 percent are reported when the rules are followed strictly, though these figures come from community backtests, not peer-reviewed research. The Silver Bullet has already been automated on NinjaTrader (ScalperIntel) and TradingView (LuxAlgo), confirming it can be expressed as a deterministic rule set.
Do I need sub-millisecond latency for ICT trading on a VPS?
No. ICT entries are based on price structure at specific levels (order blocks, FVG zones, liquidity sweeps), not on speed arbitrage. Sub-20 millisecond latency is sufficient for automated ICT execution. Same-region connectivity (5 to 20 milliseconds) handles most setups well. Same-city colocation (1 to 5 milliseconds) is excellent for scalping-oriented killzone entries but not necessary for standard ICT workflows. Home internet at 100 to 300 milliseconds creates meaningful slippage during fast killzone moves, which is the primary infrastructure argument for a VPS. The value is consistent, low-jitter connectivity during session opens, not sub-millisecond speed.
How does my EA know when DST changes?
MetaTrader does not notify EAs programmatically. Brokers announce DST shifts via the MT4/MT5 mailbox tab, which EAs cannot read. The EA must handle DST through its own logic. The recommended approach combines auto-detection for live trading (calculating the broker GMT offset via TimeCurrent() – TimeGMT() on each tick, which adjusts automatically when the broker shifts server time) with algorithmic DST rules or the DealingWithTime library (MQL5 CodeBase, covers 1975-2030) for backtesting. The EA selects the appropriate path by checking MQLInfoInteger(MQL_TESTER) at initialization.
Can I run ICT indicators on MetaQuotes’ built-in VPS?
Basic killzone and session indicators work. The built-in VPS runs standard MQL5 indicators and EAs at $12.80 to $15 per month with sub-3 millisecond latency to most brokers. The constraints that affect ICT deployments specifically: the maximum of 32 charts on the paid tier (16 on free) limits multi-pair, multi-timeframe setups, the approximately 1 to 2 GB RAM ceiling means comprehensive ICT indicators with high chart object density will push memory limits on 7 or more pairs, and there is no desktop access for visual chart review or manual markup. For alert-only setups on 3 to 5 pairs with a lightweight killzone indicator, MetaQuotes VPS is viable. For full ICT automation with Smart Market Structure Concepts or similar all-in-one toolkits across 7 or more pairs, a dedicated Windows VPS is necessary.
Why does my ICT EA work in backtesting but fail live during DST transitions?
Because TimeGMT(), TimeGMTOffset(), and TimeDaylightSavings() are not simulated in the Strategy Tester. They return the actual VPS system values at the time the backtest runs, not the historical values for the date being tested. An EA that calculates killzone boundaries using TimeGMT() will produce correct results for the current DST period in backtesting, regardless of what historical period is being simulated. The backtest appears to pass because the DST offset happens to be correct for the current season. When the live EA hits a DST transition, the same code produces a different offset, and killzone boundaries shift by one hour. The fix is using the DealingWithTime library (version 2.03 or later, required due to a CopyTime() behavior change) or algorithmic DST rules for the backtest path, while using auto-detection for the live path.
References
- ICT methodology primary sources. innercircletrader.net for canonical killzone definitions and the New York ET time anchor. TradingRage (updated March 2026) for the forex vs indices New York killzone distinction (7:00-10:00 AM vs 8:30-11:00 AM) and the five-killzone framework. icttrading.org and howtotrade.com for cross-referencing killzone times. ICT 2023 Mentorship series for macro windows (2:33-3:00 AM London Macro 1 through 3:15-3:45 PM NY Close Macro). innercircletrader.net, fxopen.com, fluxcharts.com, and grandalgo.com for Silver Bullet windows (3:00-4:00 AM, 10:00-11:00 AM, 2:00-3:00 PM ET). Used throughout Sections 2 and 4 for killzone timing and the DST contradiction (FXOpen: London Silver Bullet shifts in summer vs GrandAlgo: fixed to ET). Source quality: educational trading content. Killzone times are consistent across 5+ sources with documented contradictions noted. Individual trading outcome claims are not independently verified.
- MQL5 AlgoBook. Documentation of MQL5 time function behavior. TimeCurrent() freezes without ticks: “If there are no ticks, the server time in the terminal stands still.” TimeTradeServer() computes from VPS clock with hourly timezone rounding: “will show the minutes and seconds of the client, not the server.” All time functions except TimeCurrent() are calculated, not authoritative (confirmed in forum thread 44249). Custom TimeTradeServerExact() function documented. Used for the time function analysis in Section 3. Source quality: official MQL5 educational resource.
- MQL5 Forum, multiple threads. Thread 353654: “Your EA settings must be set at broker/server time, not MQL5 VPS time.” TimeLocal() discrepancies of 1-5 hours between VPS journal and broker order times. GMT offset calculation must not be performed in OnInit() (no connection/chart yet). MT4 single trade context limitation (Error 146) and MT5’s 8 parallel trade contexts. TimeGMT(), TimeGMTOffset(), and TimeDaylightSavings() not simulated in Strategy Tester. Broker server time standard: GMT+2 winter / GMT+3 summer to align daily close with 5:00 PM ET. Used across Sections 3, 4, and 5. Source quality: practitioner reports, consistent across multiple users and years.
- DealingWithTime library, MQL5 CodeBase (code/45287, by gooly/amrali). Handles US, EU, and Australian DST from 1975 through 2030. Strategy Tester compatible. Version 2.03 or later required due to CopyTime() behavior change that broke the original implementation. TimeGMT library for Strategy Tester (CodeBase code/48291) provides an alternative fix. Used for the DST handling recommendation in Section 4. Source quality: open-source community library with documented version history.
- TradingView indicator implementations. “FX Sessions & Killzones ET” by skullp: argues London KZ shifts to 1:00-4:00 AM EST in winter. ICT Macro indicators by reastruth, MarioLeb, and Anton_Zhezherun: confirm the eight macro windows nearly identically. LuxAlgo ICT Silver Bullet indicator: confirms Silver Bullet automation feasibility and time windows. Used for cross-referencing killzone times and macro boundaries in Section 2. Source quality: community-developed indicators, cross-referenced against primary ICT sources.
- ForexFactory Forum. Thread 1342362: confirms macro times from ICT 2023 Mentorship. “1M Price Action System” thread page 209: documents DST confusion (“Right now the times are 1 hour off still as NY changed clocks before Europe”). Thread 1303537: documents ICT creator’s public trading challenge results. Used for DST transition documentation and community validation. Source quality: community forum, anecdotal but specific and dated.
- MQL5 Market product analysis. Smart Market Structure Concepts by Jing Bo Wu ($49, MT5, 4.63/5, 104 reviews, 8,789 demos). ICT Template by David Perk ($30, MT4, 4.79/5, 69 reviews, 500+ daily users). ICT Killzones and Macros by Barend Stander ($30-32, Data Window EA integration). Simple ICT Concepts by Cao Minh Quang ($49, Global Variables export). Trading Session ICT KillZone (free). Sessions Killzone (free). “Supply and Demand Order Blocks MT5” user report: terminal “very slow/laggy.” Used for ecosystem analysis and chart object density evidence. Source quality: primary marketplace listings with verified ratings and review counts.
- MQL5 article “Market Profile Part 2: Optimization and rendering on canvas.” Documents that 4,697 rectangular graphical objects (3 days of Market Profile data) caused “significant slowdowns.” CCanvas bitmap rendering presented as the solution for high-object-count indicators. Used for the chart object density threshold evidence in Section 6. Source quality: published MQL5 technical article.
- MassiveGRID. Analysis of shared VPS behavior during session opens: “Every EA on every VPS on the same host node begins processing tick data at accelerated rates.” Execution time variability documented: “3ms normally but 150ms+ during London or NY session opens.” ICT traders identified as worst-case noisy-neighbor scenario because all activate at the same killzone times. Used for the killzone burst problem in Section 5. Source quality: VPS provider analysis. Commercially motivated but the technical observations about shared infrastructure behavior are consistent with independent reports.
- VPS provider operational data (commercially motivated). MassiveGRID, VPSForexTrader, FXVM, Hyonix for per-instance RAM figures (MT4 idle 150-200 MB, MT5 idle 250-350 MB, per-chart 30-70 MB depending on indicators). AWS burst-credit CPU model identified as problematic for killzone workloads. CPU clock speed prioritized over core count (3.5 GHz+ recommended). NVMe vs SATA SSD loading differences. VPS tier pricing: $15-150/month across four tiers. AccuWebHosting for NTP configuration guidance. UltraFX for NTP policy (“do not force time synchronization”). Used across Sections 5, 6, and 7. Source quality: technically accurate but commercially motivated. Provider names included where specific technical claims are attributed.
- NTP and clock drift documentation. Deepnet Security: typical quartz drift 2 seconds per day. VMware Timekeeping whitepaper: 8.6 seconds per day at 100 PPM. Red Hat: VMs drifting 4+ seconds or 120+ seconds with improper NTP/slew configuration. AccuWebHosting: “Windows VPS may drift by as many as a few seconds to a few minutes.” Microsoft: Hyper-V Time Sync Service does not correct clocks drifting more than 5 seconds ahead. Windows default NTP sync interval: 604,800 seconds (weekly). Used for the clock drift context supporting NTP configuration in Section 3. Source quality: mixed. VMware and Red Hat documentation is authoritative. AccuWebHosting is commercially motivated. Microsoft documentation is primary.
Editorial Note
This article covers VPS infrastructure for automating ICT strategies. It is not financial advice. No claim is made that ICT methodology, killzone trading, or any specific ICT concept produces profitable trading outcomes. The backtested Silver Bullet win rates of 60 to 75 percent cited in the FAQ originate from community backtests, not peer-reviewed research, and should not be interpreted as predictions of live performance.
ICT killzone times are cross-referenced across five or more independent sources. Where contradictions exist between sources (Asian killzone boundaries, New York forex vs indices windows, Silver Bullet DST behavior), the contradictions are documented rather than silently resolved. Traders should verify killzone times against their own broker’s behavior and the primary ICT methodology sources.
The MQL5 time function analysis reflects documented behavior as of early 2026. MetaQuotes may change the implementation of TimeTradeServer(), TimeGMT(), or Strategy Tester simulation behavior in future builds. The DealingWithTime library covers DST transitions through 2030 but will require updates beyond that date.
Chart object density estimates (80-200+ objects per chart for comprehensive ICT indicators, 150-300+ with 1,000-bar lookback) are derived from product feature analysis and MQL5 documentation, not from direct measurement on a standardized test environment. Actual object counts vary by indicator configuration, lookback depth, and market conditions.
VPS tier pricing ($15-150/month) and MQL5 Market product ratings, review counts, and pricing were verified as of March 2026. Both change frequently. Confirm current availability before purchasing.