The Fair Value Gap is a popular strategy used by price action traders as an essential building block for their technical analysis. This strategy is relatively easy to use, which makes it ideal for both beginners and expert traders for planning trades. In this post, we will delve into what this popular price pattern entails and how to trade with it effectively.
What Is FVG In Trading?
A Fair Value Gap (FVG) is a jump in price movement caused by an imbalance between buying and selling pressure. Also known as a Price Value Gap or simply “imbalance,” a Fair Value gap is formed when the price of an asset moves too quickly towards lower demand or higher supply as the case may be. On a trading chart, the Fair Value Gap represents the point where this rapid jump in price occurred.
A Fair Value Gap can be caused by various factors including major economic news or important events, economic report publications, large institutional trades, and sudden shifts in market sentiments.
On a trading chart, a Fair Value Gap is shown by a triple candle pattern that consists of a large candle whose body doesn’t overlap with the wicks of the previous candle and the one that follows it. The space between these wicks is the actual Fair Value Gap.
Fair Value Gap Indicator
A Fair Value Gap can be identified manually by looking out for the triple candle pattern or by using a Fair Value Gap indicator. The Fair Value Gap (FVG) indicator is a technical analysis tool. This tool does not give clear trade entry signals, but it can help identify areas on a trading chart where there is a significant jump in price. Since an FVG is considered an area of imbalance and can be used to pick out trading opportunities, an FVG indicator is a valuable tool for finding this balance.
The indicator generally works by looking out for large candlesticks that do not overlap other candlesticks on either side. When this tool identifies the gap, it plots a horizontal triangle over it on the chart. This rectangle can be used as a buy signal in an uptrend or a sell signal in a downtrending market.
Identifying Fair Value Gaps: Bullish Fair Value Gap
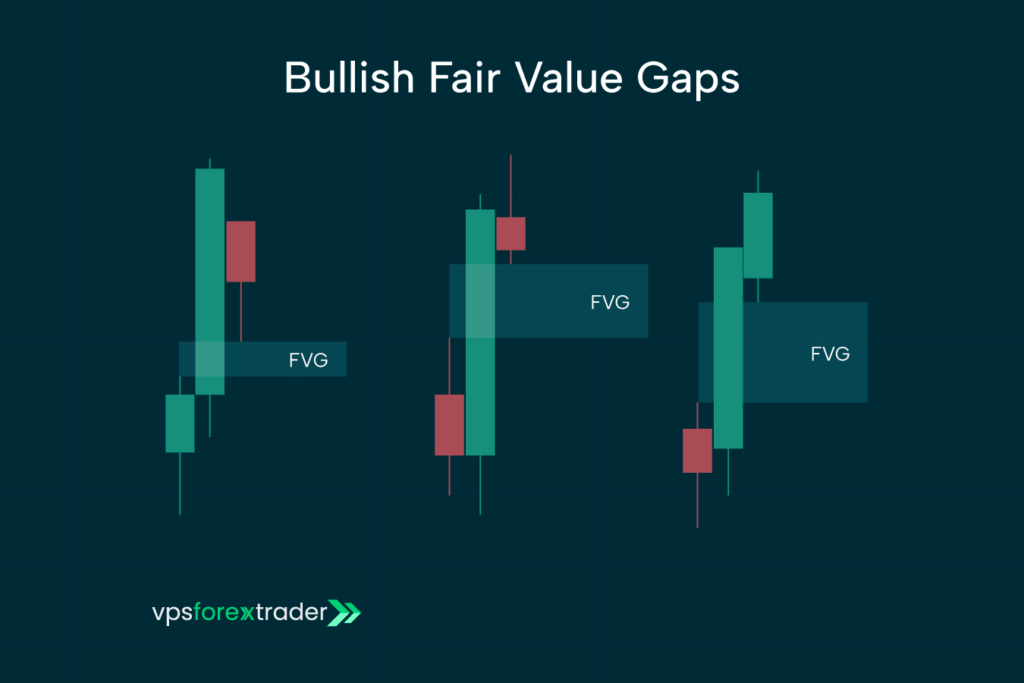
A Fair Value Gap is said to be bullish when it indicates a potential upward price movement due to a surge in buying pressure. This is typically triggered by positive economic news, great earnings reports, and a sudden shift in market sentiments toward optimism.
On a chart, a bullish Fair Value Gap is shown by a gap between the highest point of the wick of the first candle and the lowest point of the wick of the third candle. This gap indicates a potential upward price momentum with good buying opportunities for traders.
Identifying Fair Value Gaps: Bearish Fair Value Gap
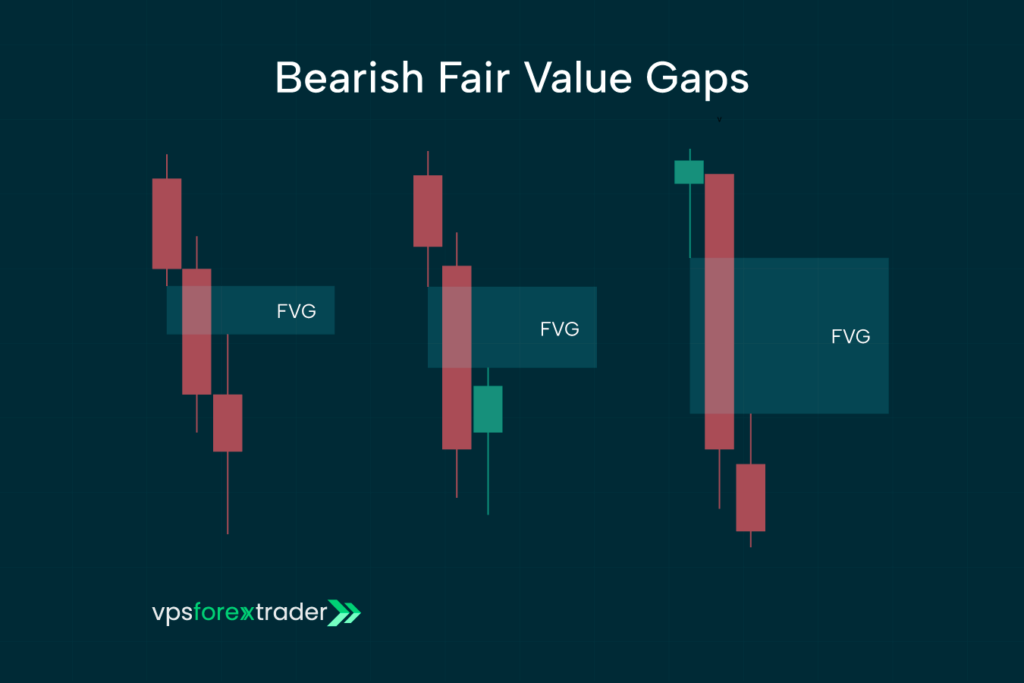
A bearish Fair Value Gap signifies a strong surge in selling pressure which causes prices to drop quickly. This is caused by factors like negative economic news, disappointing earnings reports, and sudden changes in market sentiments toward pessimism.
A Bearish Fair Value Gap is typically identified by a gap between the lowest point of the first candle’s wick and the highest point of the third candle’s wick. This gap is formed within the body of the middle candlestick due to a lack of connection between the wicks of these two candles. This is taken as an indicator of potential downward pressure.
Identifying Fair Value Gaps: Inverse Fair Value Gap
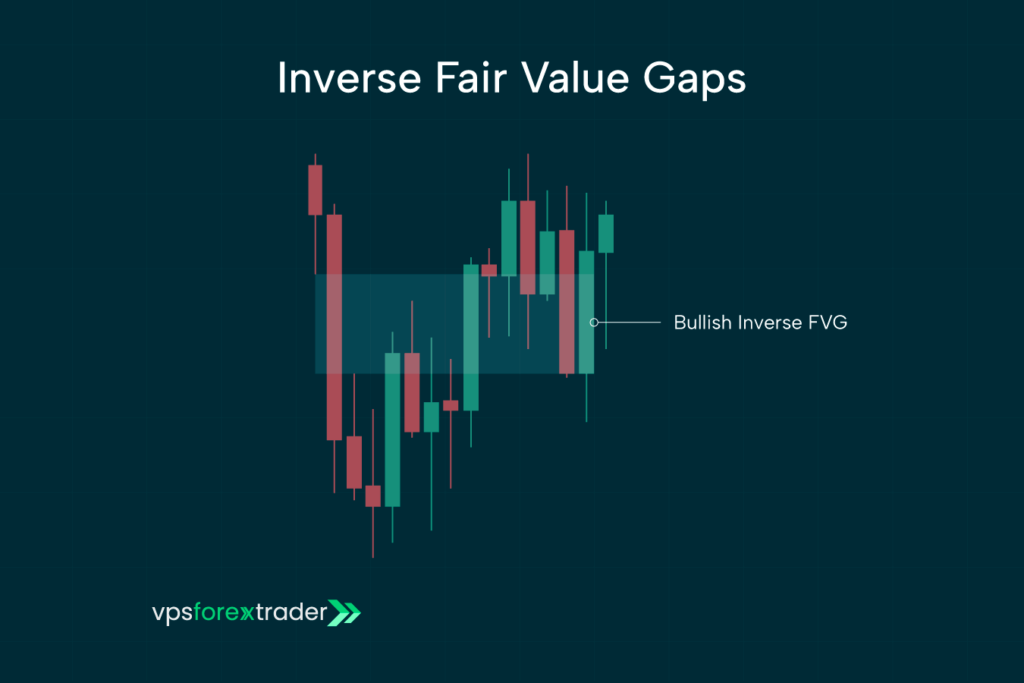
An Inverse Fair Value Gap occurs when a pre-existing FVG becomes invalidated due to a shift in market sentiments. When this happens, the role of the FVG flips, indicating that the price action has moved in a way that is contradictory to what the original FVG suggested. For instance, a bearish FVG can be invalidated by a price breakout to become a bullish inverse Fair Value Gap.
The first step in identifying an IFVG is to find the standard Fair Value Gap using the three-candle pattern as described above. This can be either bullish or bearish as the case may be. Next, you have to observe the price movement to see if it moves through and closes beyond the established FVG. The direction of the break determines if the inverse FVG is now bullish or bearish.
Pros And Cons Of Fair Value Gaps
Just like any other strategy, trading with a Fair Value Gap has both its advantages and downsides. The pros and cons of using FVG in trading are analyzed below:
Pros
- Profit potential: An accurate and successful application of a Fair Value Gap can potentially lead to significant profits.
- Reduced risk: Using FVG to inform trading decisions involves focusing on identifying market inefficiencies. This is generally less risky compared to other strategies that require you to bet on the direction of the price movement.
- Improved Market Timing: the main idea of FVG trading is to identify optimal levels where traders can enter and exit trades,
- Flexibility: FVG is a flexible strategy that can be applied to a wide range of assets. It can also be used as part of different trading strategies and works for all time frames.
Cons
- Risk of misjudgment: The main premise of using this strategy for trading is the assumption that price will reverse to fill the gap. But this isn’t always the case. In some cases, gaps may not be filled as anticipated, leading to potential losses.
- Limited opportunities: since the FVG is based on market imbalances, a trader’s chances of using this strategy successfully may be limited in highly efficient markets.
- Requires patience: when using this strategy, traders have to return for the price to return to fill the gap. This requires significant patience because it might take time.
Fair Value Gap Trading Strategy
A Fair Value Gap is a kind of imbalance in market conditions. It indicates a situation where the price of an asset has deviated from its fair value, However, since the market generally tends to return to its true value, one can take advantage of this indicator to make potentially profitable trading decisions.
To trade with this strategy, look out for a specific pattern on the chart where a large price movement creates a gap that the following candle does not fully cover. This is the FVG. Once the gap has been identified, the next step is to wait for the price to move back toward the gap and fill it. You can then make a trade based on the direction of the price movement.
For instance, say the price of an asset was moving up before the gap was created, a trader can make a buying decision when the price returns to fill the gap based on the expectation that the price will move up again.

To use FVG effectively in your trading strategy, there are some essential tips to keep in mind. They include:
- The market might not always follow the anticipated pattern, so always use risk management techniques like stop loss in order to protect yourself.
- Use a combination of indicators.
- Before entering a trade, always wait for confirmation that the original trend will continue after the FVG is filled.
- If the FVG is close to an area where liquidity can be picked, wait for this to happen before entering a trade.
Entry and Exit Strategies Using FVGs
Fair Value Gaps (FVGs) can be useful tools for identifying areas where the market may return to “fill in” inefficiencies left behind by institutional moves. But spotting a gap is only the first step. Knowing how to build an entry and exit plan around it is what turns observation into strategy.
Here’s a clear approach to entering and exiting trades based on FVGs:
1. Entry Strategy: Wait for the Retracement
The most common entry method is to wait for price to return to the FVG zone after an impulsive move has created the gap. This is often called a “retrace and react” setup.
Steps to follow:
- Identify a valid FVG formed after a strong directional move (typically marked by a large imbalance between buyers and sellers).
- Mark the zone between the first and third candles that form the gap.
- Wait for price to revisit the gap area and show signs of rejection (e.g. wick rejections, engulfing patterns, or momentum slowdowns).
A more aggressive entry is placing a limit order at the midpoint or lower boundary of the FVG. A more conservative approach is to wait for price to enter the zone and then confirm direction with a bullish or bearish close, depending on your trade bias.
2. Stop-Loss Placement
Risk management is critical when trading FVGs, especially since gaps don’t always fill cleanly.
Good stop-loss practices include:
- Placing your stop slightly beyond the opposite side of the FVG zone. For a bullish setup, that would be just below the gap; for a bearish one, just above it.
- Avoid placing stops exactly at the edge of the zone, as price can often wick through before reversing.
- If the trade is based on a higher timeframe FVG, ensure your stop accounts for that volatility.
3. Take-Profit Strategy
There are a few common ways to set profit targets when trading FVGs:
- Return to Structure: Target a recent swing high or low before the gap was formed.
- Measured Move: Use Fibonacci extensions or projected price legs to estimate the next likely move.
- Partial Scaling: Consider scaling out at 1:1 and 2:1 risk-to-reward levels while trailing your stop on the remaining position.
Some traders also choose to hold the position until the next opposite FVG appears, or until signs of exhaustion emerge based on volume or candle structure.
Common Mistakes and How to Avoid Them
Fair Value Gaps have become a popular concept among price action and ICT-style traders, but they’re often misunderstood and misused. Spotting an imbalance is easy – trading it correctly requires more discipline. Here are the most common mistakes traders make when using FVGs, and how to avoid them:
1. Misidentifying the Fair Value Gap
Not every gap between candles is an actual FVG. Some traders mark weak imbalances or unclear setups, leading to inconsistent trades. A valid FVG typically forms when a strong impulsive candle leaves behind an unfilled space between its body and the candles before and after.
How to avoid it:
Only mark FVGs that follow strong price displacement – clear, one-directional moves where price skips over a price range without trading in it. Stick to clean gaps, ideally on timeframes like 1H, 4H, or daily for higher probability.
2. Entering Without Confirmation
Jumping into a trade just because price enters an FVG is risky. Price doesn’t always react immediately or in the direction you expect. It might blow through the zone entirely.
How to avoid it:
Wait for confirmation. This could be a shift in market structure, a reversal candle pattern, or a lower-timeframe break of structure that aligns with your bias. You’re not just trading the gap – you’re trading the reaction to it.
3. Ignoring Market Context
An FVG on its own doesn’t mean much. If it forms against the broader trend or inside a consolidation zone, the chance of it holding is much lower.
How to avoid it:
Zoom out. Is the market trending or ranging? Is the FVG in line with your directional bias? Is there confluence with other tools like support and resistance or previous highs and lows? Trade FVGs that make sense within the bigger picture – not just because they appear.
4. Poor Risk Management
Because FVGs often invite tight stop placements, some traders go in too heavy with small stops, expecting fast moves. But if the FVG doesn’t hold, the loss hits harder than expected.
How to avoid it:
Always set your stop-loss slightly beyond the FVG boundary and size your position based on the risk – not based on where you want to take profit. Treat the FVG like any other technical setup: structure first, size second.
FAQs About FVG
What is Fair Value Gap in trading
A Fair Value Gap (FVG) is a price gap that occurs due to an imbalance between demand and supply, causing a significant gap in the price of an asset. The rapid price movement causes the price to skip over certain price levels, creating a gap where no trades occur.
How to Find Fair Value Gap
You can find a Fair Value Gap on a trading chart by either looking out for the triple candle pattern or by using a Fair Value Gap indicator.
What does a Fair Value Gap look like
The Fair Value Gap appears on a chart as a gap between three candles. The key to identifying this pattern is to look for a pattern where the high of the first candle and the low of the third candle are not fully covered by the large candle between them. This essentially leaves a “blank space” on the chart.


