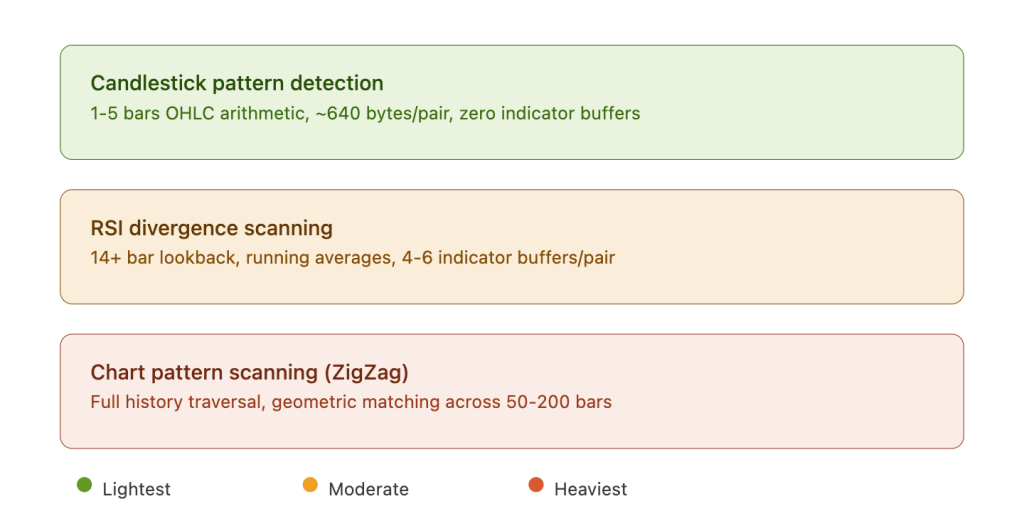
A candlestick pattern check performs 5 to 15 arithmetic operations on 1 to 5 bars of OHLC data. No indicator buffers, no lookback accumulation, no persistent state. A doji detection is a single comparison: is the absolute difference between close and open less than a threshold percentage of the bar’s total range? An engulfing check compares four values across two consecutive bars. Even the most complex standard patterns (Rising and Falling Three Methods) need only 5 bars. For 28 pairs checking 25 patterns each, a full scan cycle amounts to roughly 7,000 arithmetic operations, trivial for any modern CPU.
The infrastructure challenge is not detection. It is what happens after detection. Thirty pattern types across 28 pairs and 4 timeframes create 3,360 possible signal slots per scan cycle. At a conservative 5% detection rate, that produces 168 potential alerts in a single pass. The SendNotification() rate limit of 10 per minute cannot absorb that volume. Without filtering and routing, the alert system breaks before the scanner does.
This makes candlestick pattern scanning a unique workload in the scanner article family: the lightest detection footprint (zero indicator buffers, pure OHLC arithmetic) combined with the highest alert throughput requirement. The opposite of RSI divergence scanning, which is computationally heavier but produces only 2 to 5 signals per day.
This article covers how candlestick detection algorithms work at the code level, what scanner products exist on the MQL5 marketplace, the memory and CPU profiles for different scanner configurations with specific calculations, and how to manage the alert volume that lightweight detection produces at scale. Resource figures draw from MQL5 documentation, marketplace product data, forum benchmarks, and Forex VPS provider guides. Single-source and commercially interested figures are flagged.
How candlestick detection works at the code level
Every candlestick in MetaTrader is stored as an MqlRates structure containing 8 fields: time, open, high, low, close, tick volume, spread, and real volume. The raw size is 60 bytes per bar, with potential padding to 64 bytes for struct alignment. This is the fundamental data unit. A scanner checking doji patterns needs at most 1 to 3 bars of this data per symbol and timeframe. An engulfing scanner needs 2 bars. Morning and Evening Star need 3. The most complex standard patterns need 5. Compare this to indicator-based scanning: RSI requires 14+ bars of accumulated gain and loss data with running averages, and ZigZag for chart pattern detection requires traversal of entire chart history. Candlestick detection operates on a fundamentally smaller data window.
The detection logic itself is pure OHLC arithmetic. The official CCandlePattern class from the MQL5 Wizard illustrates the approach. A doji check amounts to: is the absolute value of close minus open less than a threshold multiplied by the bar’s total range (high minus low)? The threshold is typically 0.05 to 0.10, meaning the body must be less than 5 to 10% of the total range. A bullish engulfing check confirms that the current bar’s body completely contains the previous bar’s body in the opposite direction: close of bar zero is greater than open of bar one, and open of bar zero is less than close of bar one, with the current body larger than the previous. A hammer or pin bar check verifies that the lower wick is at least 2x the body length and the upper wick is less than 10% of the total range. Each of these checks involves subtraction, division for ratios, comparison operators, and MathAbs(). No lookback accumulation, no persistent state, no complex math. Each check is independent of the previous scan cycle’s results.
Three implementation approaches exist, and they have dramatically different resource profiles on a VPS. Hardcoded MQL5 logic (if/else comparisons on OHLC values) requires only the few bars fetched via CopyRates(), creates no indicator buffers, and needs no inter-process communication. Memory per pair: approximately 640 bytes (10 bars at 64 bytes each). CPU per check: under 1% per pair. One experienced MQL5 developer summarized the consensus: “In my own coding, I try not to depend on Indicators and instead transfer the calculations to the EA itself, and reduce them to incremental calculations, so as not to depend on any buffer at all.” The iCustom indicator approach creates a separate indicator instance with full buffer history maintained in memory. Each buffer consumes bars multiplied by 8 bytes. At 100,000 default bars, that is approximately 781 KB per buffer, and commercial candlestick indicators often use multiple buffers. An additional problem documented in the community: some commercial indicators use graphical text objects rather than indicator buffers for signal output, making programmatic extraction impossible and creating thousands of chart objects over time that cause progressive terminal slowdown. ML and neural network approaches (GAF-CNN, YOLO object detection, Random Forests) have been tested in academic research but require 100 to 1,000x more CPU and 1 to 10+ GB of RAM. Research from multiple papers concluded that rule-based detection on time-series data actually outperforms CNN-based approaches for candlestick pattern classification in most benchmarks, making ML impractical for VPS deployment on both resource and accuracy grounds.
One parameter with direct infrastructure consequences: the pattern sensitivity threshold. A doji threshold of 5% (body less than 5% of range) fires less frequently than 10%. Tighter thresholds detect fewer patterns, generating fewer alerts, reducing the pressure on notification rate limits. Looser thresholds detect more patterns, generating more alerts, potentially overwhelming SendNotification() within minutes. The threshold setting is simultaneously a signal quality decision and an infrastructure capacity decision.
What the MQL5 marketplace offers
The MQL5 marketplace has an active ecosystem of candlestick pattern scanners, but no product documents VPS resource requirements and no product offers native Telegram integration. Evaluating these tools through an infrastructure lens separates the products suited for always-on VPS deployment from those designed for desktop monitoring.
The most feature-complete product is the All in One Candlestick Pattern Scanner by Amir Atif, available for both MT4 and MT5 at $60. It detects 25 patterns across single-bar (hammer, shooting star, doji variants, marubozu, pin bar), two-bar (engulfing, inside bar, harami, piercing, dark cloud cover, tweezer), three-bar (morning and evening star, three white soldiers, three black crows), and five-bar (rising and falling three methods) formations. The dashboard scans all selected symbols across all 9 timeframes simultaneously. The developer claims it “works smoothly for 80 symbols and all 9 timeframes on an average PC,” meaning 720 symbol-timeframe combinations at once. That claim is vendor marketing and has not been independently benchmarked, but it is internally consistent with the lightweight arithmetic profile of candlestick detection. The most VPS-relevant feature is a “fast and lightweight bridge” version with graphical objects removed, explicitly designed for EA integration via iCustom. This acknowledges what the developer clearly understands: the full dashboard with pattern labels and zone overlays consumes substantially more resources than the detection logic alone.
The KT Candlestick Patterns Scanner by KEENBASE ($75, MT4 and MT5) detects 25+ patterns and is designed to scan 28 currency pairs across 9 timeframes (252 combinations) from a single chart. It includes click-to-open-chart functionality for reviewing detected patterns. The Ultimate Candle Patterns by Wojciech Daniel Knoff ($30, MT5) offers the highest pattern count found at 46 types, though it is limited to 10 symbol-timeframe combinations, making it less suited for broad multi-pair scanning.
The Candlestick Pattern Scanner Dashboard by Biswarup Banerjee ($30, MT4 and MT5) detects 15 patterns and supports confluence alerts when multiple timeframes align on the same pattern. A user review raises a VPS-relevant concern: “Alerts often fire long after the first possible minute.” This latency issue could stem from inefficient scan timing, excessive graphical rendering, or the OnTick-versus-OnTimer implementation choice covered in the scan frequency section below.
On the free side, the Japanese Candlestick Patterns indicator by Ronnie Mansolillo in the MQL5 Code Base has 64,683 views and 80 ratings, making it one of the most widely used candlestick tools. A critical VPS finding emerged from the comments: a user reported in October 2025 that “the code is written in a way that takes so much resources of the computer, leaving it at its knees,” identifying inefficient For loops as the cause. A community member responded with an optimized version offering improved CPU performance. This is direct evidence that candlestick pattern detection, despite being arithmetically simple, can destroy VPS resources through poor implementation. The algorithm is cheap. The code quality determines whether that cheapness translates to actual low resource usage.
The official CCandlePattern class published by MetaQuotes in the MQL5 Code Base (2011) is the most authoritative reference implementation. It supports 14+ patterns via ENUM_CANDLE_PATTERNS enumeration, uses AvgBody() for relative body size comparisons, and can be extended with oscillator confirmation. It is designed for the MQL5 Wizard auto-generation framework and is not a standalone scanner, but its pattern detection logic is the baseline against which commercial products should be measured.
Memory profile: why candlestick scanners are the lightest workload
The memory footprint of a candlestick-only scanner is determined almost entirely by the OHLC price data it loads, because the core detection logic creates no indicator buffers. This is the fundamental difference from every other scanner type in this article series, and it makes candlestick scanning the only workload that fits comfortably on a 2 GB VPS.
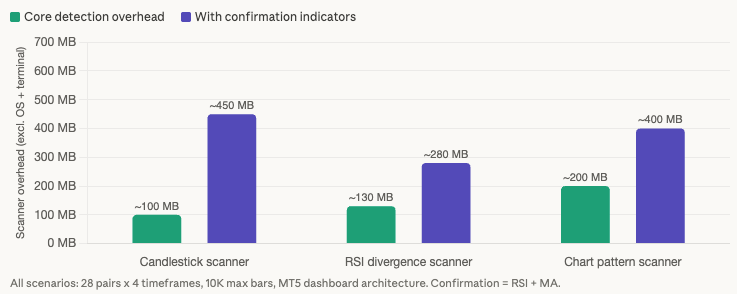
For 28 pairs across 4 timeframes (M15, H1, H4, D1) with max bars set to 5,000 (the recommended VPS setting from our MT4 optimization guide), the raw OHLC data calculation is straightforward: 112 symbol-timeframe combinations multiplied by 5,000 bars multiplied by 64 bytes per MqlRates structure equals approximately 34 MB. That is the raw data footprint for the entire scanner. MT5’s internal caching mechanism multiplies real memory consumption by a factor of 2 to 5x (inferred from multiple forum reports but not systematically benchmarked), bringing the working estimate to 50 to 150 MB of scanner overhead on top of the terminal baseline.
Compare this to the RSI divergence scanner profiled in our divergence scanning article. That workload creates 112 iRSI handles at 78 KB each (at 10,000 max bars), consuming approximately 8.75 MB in RSI buffers alone. Adding 4 divergence detection buffers per handle brings the total indicator overhead to approximately 44 MB. On top of that sits the same OHLC price data, plus the 3x internal structure overhead measured in forum benchmarks. Total RSI scanner overhead: approximately 110 to 150 MB. A chart pattern scanner using ZigZag requires full history traversal and maintains even larger buffer sets. The candlestick scanner at 50 to 150 MB is lighter than both, and the gap widens as max bars increases because indicator buffers scale linearly with bar count while the candlestick scanner’s OHLC-only data remains the same.
The picture changes substantially when confirmation indicators enter the configuration. Most practical candlestick scanner deployments add 1 to 3 confirmation indicators: RSI for momentum context, a moving average for trend direction, or volume analysis for signal validation. Each iRSI() or iMA() handle in MT5 creates its own indicator instance with an internal timeseries copy. One forum developer measured that “a simple multitimeframe indicator with no buffers needs 30 MB after calls to ArrayCopyRates,” and each additional instance consumes memory independently. Adding RSI confirmation across 112 symbol-timeframe combinations adds approximately 100 to 250 MB. Adding a moving average adds another 100 to 250 MB. A candlestick scanner with two confirmation indicators consumes 250 to 650 MB of total scanner overhead, more than tripling the candlestick-only footprint.
This creates a clear decision point for VPS planning. The candlestick-only configuration (50 to 150 MB overhead) fits on a 2 GB VPS with MT4 after accounting for Windows Server (800 MB to 1.2 GB), the MT4 baseline (150 to 200 MB), and the 25% free RAM rule. Adding confirmation indicators pushes the requirement to 4 GB. The confirmation indicators are not optional from a signal quality perspective. Community consensus on candlestick patterns is blunt: one MQL5 forum moderator stated “I’ve never found these patterns to be consistent enough to trade from,” and a ForexFactory developer reported that backtesting showed “either very small profits or small losses.” Confluence filtering (pattern plus support/resistance plus trend plus volume) is what transforms raw pattern detection into actionable signals. On a 2 GB VPS, the trader gets detection without confirmation. On a 4 GB VPS, the trader gets both.
VPS tier planning for candlestick scanners
The memory profile from the previous section translates into specific tier recommendations. Candlestick scanning is the only workload in this article series where a 2 GB VPS is a realistic option, but the constraints at that tier are severe enough that most traders will land on 4 GB.
A 2 GB VPS works for a candlestick-only scanner on MT4 with aggressive optimization. After Windows Server (800 MB to 1.2 GB) and the MT4 baseline (150 to 200 MB), approximately 600 to 1,050 MB remains before applying the 25% free RAM reservation. The candlestick scanner overhead of 50 to 150 MB fits within this budget. The constraints are non-negotiable: MT4 only (MT5’s higher baseline of 250 to 350 MB shrinks headroom to dangerously thin margins), max bars reduced to 5,000, Market Watch cleaned to scanned pairs only, no confirmation indicators, and no additional charts or EAs beyond the scanner. This configuration detects patterns but cannot evaluate their quality through RSI momentum, trend direction, or volume context. For traders who use the scanner purely as an alert trigger and perform confirmation analysis manually on a separate device, this is a functional setup. For traders who want automated confluence filtering, it is insufficient.
A 4 GB VPS is the recommended tier. After Windows and an MT5 terminal (approximately 1.3 to 1.5 GB combined), roughly 2.5 to 2.7 GB remains. A candlestick scanner with RSI and moving average confirmation consumes 250 to 650 MB of scanner overhead, leaving 2.0 to 2.4 GB of headroom. This accommodates a separate trading terminal with a few charts and execution EAs, memory growth over the trading week, and tick volume spikes during news events. The 4 GB tier also supports scaling to 40+ pairs with a single confirmation indicator, or maintaining the 28-pair configuration with 3 confirmation indicators (RSI, MA, and volume) simultaneously. This is where the alert volume management covered later in the article becomes essential, because more pairs and more confirmation indicators mean more detected confluences and more notifications to route.
An 8 GB VPS supports configurations that would be unusual for candlestick scanning alone but make sense for combined workloads. Running a candlestick scanner alongside an RSI divergence scanner (profiled in our divergence scanning article at 110 to 150 MB indicator overhead) on the same VPS requires approximately 360 to 800 MB of combined scanner overhead plus two terminal instances. After Windows, two MT5 terminals, and both scanners, roughly 4.5 to 5.5 GB remains. This tier also handles heavy multi-timeframe scanning across all 21 MT5 timeframes or scanning 80+ symbols (the maximum the All in One Scanner by Amir Atif claims to handle smoothly).
CPU planning for candlestick scanners is straightforward because the arithmetic is trivial. With OnTimer(30) and bar-close-only detection, a 25-pattern scan across 28 pairs and 4 timeframes consumes under 5% CPU on a modern VPS core. Adding RSI and moving average confirmation increases this to roughly 10 to 15%. Both figures assume well-coded scanners. Poorly coded implementations produce dramatically different results: one MQL5 forum user reported 12 to 15% CPU per currency pair added to their scanner EA, and another reported 80% CPU with 3 GB RAM on a Core i7 6700 for a multi-symbol scanner. These outliers reflect implementation quality, not algorithmic complexity. The 80% max CPU sustained ceiling from the cross-article rules leaves ample margin for a well-implemented candlestick scanner at any tier, but a poorly coded product can exhaust CPU on hardware that should handle the workload effortlessly.
Scan frequency: the 600x CPU reduction
Using OnTick() for candlestick scanning is catastrophically wasteful. During the active London session, EUR/USD generates approximately 10 ticks per second. Across 28 pairs, tick volume can reach hundreds per second. If the scanner recalculates all 25 patterns on every tick for every pair, it processes tens of thousands of scans per hour, the vast majority of which produce identical results to the previous scan because no new bar has formed. Candlestick patterns are only valid on closed bars. A forming bar’s pattern is meaningless because the final close, which determines whether a doji or engulfing or hammer actually exists, is not known until the bar completes.
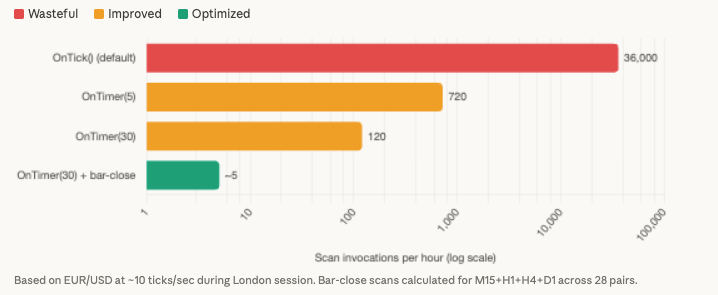
Switching from OnTick() to OnTimer() with a 60-second interval reduces the base check frequency from approximately 36,000 per hour (on EUR/USD alone at 10 ticks per second) to 60 per hour. That is a 600x reduction in scan invocations from a single configuration change. One MQL5 forum user measured the impact on a real scanner: CPU dropped from 80 to 90% down to 30 to 50% after implementing OnTimer(5) on 10 pairs. This is a single forum report and the specific percentages have not been independently replicated, but the directional finding is consistent with the expected behavior because timer-based polling eliminates all inter-bar recalculation.
Adding bar-close-only detection logic inside the OnTimer() callback produces a second layer of reduction. The check is a single comparison per symbol and timeframe: if the current bar’s opening time equals the stored previous bar time, skip processing entirely. With OnTimer(60) as the base, the scanner fires 60 times per hour but only performs actual pattern detection when a monitored timeframe’s bar has closed. On M15, a new bar opens 4 times per hour. On H1, once. On H4, once every 4 hours. On D1, once per day. For the recommended configuration of 28 pairs across M15, H1, H4, and D1, the scanner performs approximately 125 actual scan operations per hour (28 pairs multiplied by the combined bar frequency across four timeframes) instead of the 36,000+ that OnTick() would produce on a single pair. With a smart timer implementation that checks which specific timeframe just closed and scans only those symbol-timeframe combinations, the reduction reaches 2,000 to 4,000x.
The recommended implementation uses EventSetTimer(30) as the base timer with internal iTime() comparison to detect new bars on each timeframe independently. Community consensus from experienced MQL5 developers supports this approach: “Most scanners I write scan every 5 seconds because I don’t need instant updates across dozens of symbols.” A 30-second timer catches every M1 bar close with margin and every higher timeframe bar close with certainty, while keeping the CPU cost negligible between bar completions.
The scan frequency table illustrates why OnTick() is indefensible for this workload. D1 candles complete once per day, requiring exactly 1 scan per day per pair. H4 candles complete 6 times per day. H1 completes 24 times. Even M15, the most frequent timeframe in the recommended configuration, completes only 96 times per day. The total across all four timeframes and 28 pairs is roughly 3,500 meaningful scan events per day. OnTick() would perform millions.
Alert volume management: the real infrastructure constraint
The alert volume math separates candlestick scanning from every other scanner type in this series. An RSI divergence scanner across 28 pairs produces roughly 2 to 5 signals per day. A supply and demand zone monitor produces similar frequency because zones persist for days before price approaches. A candlestick scanner checking 30 pattern types across 28 pairs and 4 timeframes creates 3,360 possible signal slots per scan cycle. Even with a conservative 5% detection rate, a single M15 bar close can generate over 100 potential alerts. Without aggressive filtering, the notification system fails before the scanner encounters any resource constraint.
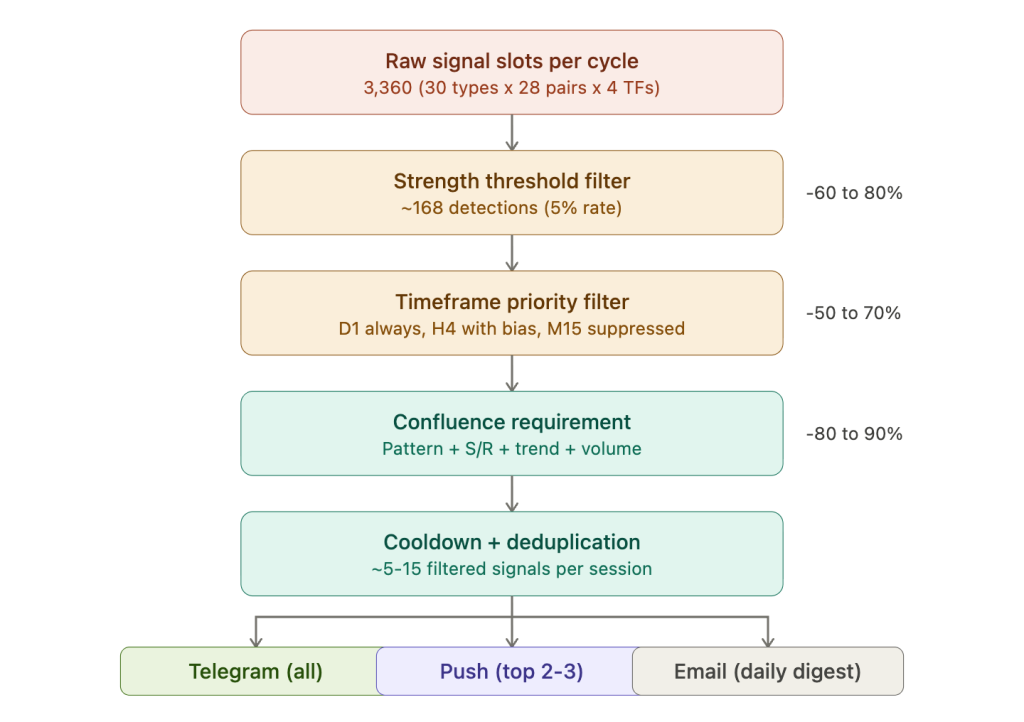
The SendNotification() rate limit is the first wall. MetaQuotes enforces a hard ceiling of 2 calls per second and 10 per minute, monitored dynamically. Exceeding the limit triggers error code 4518 (ERR_NOTIFICATION_TOO_FREQUENT). Forum evidence documents that after approximately 30 rapid calls, the push notification channel can be banned entirely, and the ban appears indefinite. Additionally, SendNotification() does not work on the MetaQuotes built-in VPS, where multiple users report connectivity failures to the notification server. For a scanner that might detect 168 patterns in a single scan cycle, 10 notifications per minute is not a throughput constraint to optimize around. It is a structural incompatibility with the workload’s output volume.
Telegram via WebRequest() to the Bot API is the practical solution. The rate limit of 1 message per second per chat (60 per minute) provides 6x the throughput of push notifications. Across multiple chat channels, the global limit is 30 messages per second. Messages support 4,096 characters, enough to batch multiple detections into a single consolidated notification: “3 new patterns: EURUSD H4 Engulfing / GBPJPY D1 Hammer / AUDUSD H1 Doji.” Chart screenshots via ChartScreenShot() can be sent through the sendPhoto endpoint, though the file save process requires a wait loop of up to 30 seconds. Configuration requires adding https://api.telegram.org to the URL whitelist in Tools, then Options, then Expert Advisors. This must be set manually on each VPS terminal instance.
Five filtering strategies bring alert volume within rate limits while preserving signal quality. Pattern strength thresholds tighten the detection parameters: requiring a doji body below 5% of range instead of 10%, engulfing body larger than 0.5x ATR, or hammer wick at least 2.5x body length eliminates 60 to 80% of marginal detections. Timeframe priority tiers route alerts selectively: D1 patterns always sent, H4 sent only when matching D1 directional bias, H1 only with multi-indicator confluence, M15 suppressed entirely or restricted to the strongest pattern types. Confluence requirements demand that a pattern occurs within 1x ATR of a key support or resistance level, aligns with the moving average slope or higher-timeframe trend, and shows above-average tick volume. Requiring 2 or more confluences reduces alert volume by 80 to 90%. Cooldown timers per symbol prevent repeated alerts on the same pair within a defined window: 30 minutes for M15, 2 hours for H1, 8 hours for H4, 24 hours for D1. This is implemented with a globally declared datetime array tracking the last alert time per symbol. Batched digest notifications queue all detections into a string buffer and send a single consolidated message every N minutes, staying within SendNotification() limits if push is used or maximizing information density per Telegram message.
Email via SendMail() is best reserved for daily summary digests consolidating all detected patterns and their outcomes. It shares approximate rate limits with push notifications (roughly 10 per minute) and supports only plain text. On MT4, SendMail() does not support SSL for SMTP, which means Gmail does not work natively. MT5 supports TLS. Alternative SMTP providers that work reliably from VPS include GMX (mail.gmx.com on port 587) and dedicated relay services like SMTP2GO.
The recommended multi-tier routing: Telegram as primary for all filtered signals with optional chart screenshots, push notifications reserved for the 2 to 3 highest-confidence confluent patterns per session (staying well within 10 per minute), and email for an end-of-day digest summarizing all activity.
Scanner-specific VPS optimization
The general VPS optimizations covered in our MT4 optimization guide apply to candlestick scanner deployments, but two issues specific to candlestick scanners deserve attention beyond the standard checklist.
Reducing max bars remains the highest-impact optimization. The memory profile section quantified the difference: 34 MB of raw OHLC data at 5,000 max bars versus hundreds of megabytes at defaults, before MT5’s caching multiplier. For candlestick pattern detection, 5,000 bars on H4 covers approximately 3 years of price history. The most complex standard patterns need 5 bars of lookback. The remaining 4,995 bars serve no purpose for detection and exist only to waste RAM. Cleaning the Market Watch to only scanned symbols yields the documented 20 to 40% CPU reduction (sourced from FXVPS.biz, flagged as a single commercially interested source). Switching to OnTimer() with bar-close-only detection produces the 600x CPU reduction covered in the scan frequency section. Disabling chart rendering (grid, volumes, bid/ask lines, OHLC display) on the scanner terminal eliminates visual overhead on a screen no human watches. These four optimizations are shared with every scanner type in the article series.
The issue specific to candlestick scanners is graphical object accumulation. Many commercial candlestick indicators and some CodeBase implementations draw pattern labels, arrows, and zone rectangles as chart objects rather than using indicator buffers. Each detected pattern creates one or more objects. Over weeks of continuous operation across 28 pairs and 4 timeframes, these objects accumulate into the tens of thousands. One MQL5 forum user traced progressive terminal slowdown to over 100,000 chart objects created by a pattern indicator that never deleted old labels. The terminal’s memory grew continuously as the object list expanded. For scanners that use graphical objects, configure the indicator to auto-delete objects older than a defined number of bars, or implement periodic ObjectsDeleteAll() calls in the scanner EA’s code during the weekly restart cycle. When evaluating marketplace products, the “lightweight bridge” version offered by Amir Atif’s All in One Scanner (which removes graphical objects entirely for EA integration) is the VPS-appropriate choice over the full dashboard version.
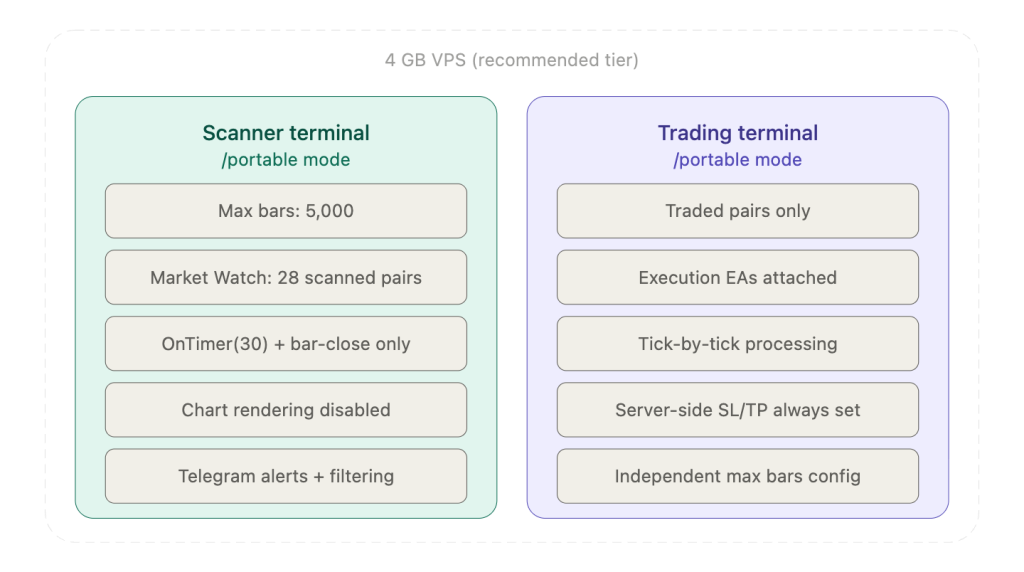
Running the scanner terminal in portable mode isolates it from the trading terminal on the same VPS. Each portable installation maintains independent max bars settings, Market Watch configuration, and chart templates. The scanner terminal runs with 5,000 max bars and a cleaned Market Watch containing only scanned symbols. The trading terminal runs with whatever configuration the execution EAs require. Profile conflicts between the two are impossible because their data directories are physically separate. This two-terminal architecture, covered in detail in our MT4 vs MT5 VPS comparison, is the recommended production deployment for any scanner workload.
FAQ
Can a 2 GB VPS really handle a candlestick scanner?
Yes, but only as a candlestick-only scanner on MT4 with no confirmation indicators. The scanner overhead of 50 to 150 MB fits after Windows Server (800 MB to 1.2 GB) and the MT4 baseline (150 to 200 MB) claim their share. The configuration requires max bars at 5,000, Market Watch cleaned to scanned pairs, and no additional charts or EAs. MT5 does not fit reliably at this tier because its higher baseline (250 to 350 MB) compresses headroom below safe margins. The practical question is whether detection without confirmation is useful. Community consensus suggests candlestick patterns alone produce too many false signals for unfiltered trading. If the scanner’s purpose is sending alerts to a phone for manual review and confirmation on a separate charting platform, the 2 GB setup works. If the goal is automated confluence filtering, 4 GB is the minimum.
Why not just use TradingView’s built-in pattern recognition instead of a VPS scanner?
TradingView detects candlestick patterns natively and sends alerts to mobile devices. For traders who monitor a small number of pairs on specific timeframes and are comfortable with TradingView’s detection logic, this is a simpler solution that requires no VPS. The VPS scanner approach adds value in three specific scenarios: scanning 28+ pairs simultaneously across multiple timeframes (TradingView alert limits restrict this on most subscription tiers), integrating pattern detection directly with MetaTrader execution (the scanner EA writes signals to global variables or files that a trading EA consumes), and customizing detection parameters (threshold ratios, minimum body sizes, ATR-adaptive sizing) beyond what TradingView’s fixed implementation allows.
Do candlestick patterns actually produce profitable signals?
This article covers the infrastructure for running candlestick scanners, not the trading validity of the patterns themselves. The community evidence is worth noting for context: a ForexFactory developer reported that backtesting showed “either very small profits or small losses” for candlestick patterns alone. An MQL5 forum moderator stated “I’ve never found these patterns to be consistent enough to trade from.” The practical consensus is that candlestick patterns function as filters within a broader strategy (pattern at a key support/resistance level, confirming a higher-timeframe trend, with above-average volume) rather than as standalone entry signals. This consensus directly shapes the infrastructure recommendation: confirmation indicators are effectively mandatory, which pushes the minimum practical VPS tier from 2 GB to 4 GB.
How do I choose between a 25-pattern and 46-pattern scanner for VPS deployment?
More patterns does not mean better scanning on a VPS. Each additional pattern type increases the potential alert volume without proportionally increasing signal quality. The All in One Scanner (25 patterns) covers every standard reversal, continuation, and indecision pattern that the trading community considers actionable. The Ultimate Candle Patterns (46 types) adds niche formations that generate additional detections but are less widely traded and less likely to produce institutional-level price reactions. For VPS alert management, fewer well-filtered patterns are preferable to more unfiltered ones. The 25-pattern scanner with strength thresholds and confluence requirements produces fewer, higher-quality alerts than a 46-pattern scanner with default sensitivity.
Can I run a candlestick scanner alongside an RSI divergence scanner on the same VPS?
On a 4 GB VPS, this is tight but feasible if both scanners use the dashboard architecture from a single terminal. Combined scanner overhead is approximately 160 to 300 MB for the candlestick scanner (with one confirmation indicator) plus 110 to 150 MB for the RSI divergence scanner, totaling 270 to 450 MB. After Windows and one MT5 terminal, roughly 2.2 to 2.7 GB remains, so the combined scanners fit with headroom. On an 8 GB VPS, both scanners can run from separate terminal instances with independent optimization settings and ample margin. The alert routing architecture must account for both scanners’ output volume. Telegram handles the throughput easily. SendNotification() does not, and running both scanners through push notifications will exceed the 10-per-minute ceiling during active sessions.
References
- MetaQuotes Software Corp. MQL5 Reference: MqlRates structure definition. Documents 8 fields totaling 60 bytes per bar (64 bytes with struct alignment padding). Accessed March 2026.
- MetaQuotes Software Corp. MQL5 Reference: SendNotification() function. Documents rate limits of 2 calls per second and 10 per minute, 255-character maximum, error code 4518 (ERR_NOTIFICATION_TOO_FREQUENT). Dynamic monitoring can permanently disable the function. Accessed March 2026.
- MetaQuotes Software Corp. MQL5 Code Base: CCandlePattern class (2011). Official pattern recognition library for MQL5 Wizard. Supports 14+ patterns via ENUM_CANDLE_PATTERNS enumeration. Implements AvgBody() for relative body size comparisons.
- Voronkov, D. “Analyzing Candlestick Patterns.” MQL5 Articles, 2010. Foundation article defining CANDLE_STRUCTURE and RecognizeCandle() function.
- MetaQuotes Software Corp. “Studying Candlestick Analysis Techniques.” MQL5 Articles, 4-part series, 2018 to 2019. OOP framework with CPattern class. Notes 1,463 possible pattern combinations.
- “From Novice to Expert: Programming Candlesticks.” MQL5 Articles, 2025. Creates infinity_candlestick_pattern.mqh with ATR-based adaptive sizing.
- CandlePatternSearch.mq5. MQL5 Code Base, 2025. Complete scanner framework with GUI. Developer noted “completed in under a second” for full scan mode.
- Amir Atif. All in One Candlestick Pattern Scanner. MQL5 Market, MT4/MT5, $60. Rated 4.8/5 (MT5) and 5/5 (MT4). Detects 25 patterns, claims 80 symbols across 9 timeframes “on an average PC.” Offers lightweight bridge version for EA integration. Performance claim is vendor marketing, not independently benchmarked.
- KEENBASE SOFTWARE SOLUTIONS. KT Candlestick Patterns Scanner. MQL5 Market, MT4/MT5, $75. 25+ patterns, 28 pairs across 9 timeframes from single chart.
- Knoff, W.D. Ultimate Candle Patterns. MQL5 Market, MT5, $30. 46 pattern types, highest count found. Limited to 10 symbol-timeframe combinations.
- Banerjee, B. Candlestick Pattern Scanner Dashboard. MQL5 Market, MT4/MT5, $30. 15 patterns with confluence alerts. User review documents alert latency: “Alerts often fire long after the first possible minute.”
- Mansolillo, R. Japanese Candlestick Patterns. MQL5 Code Base, free, 64,683 views. User-reported CPU overload from inefficient For loop implementation (October 2025). Community-provided optimized version available.
- MQL5 Forum. William Roeder (32,000+ posts): indicator buffer memory formula. “Every indicator is adding 4x 200,000 per buffer. That’s ~1 MB x how many buffers x how many indicators.” Moderator Alain Verleyen: “From my experience most EAs which ‘use a lot of CPU resource’ are not well coded.”
- MQL5 Forum. OnTimer() CPU reduction from 80 to 90% down to 30 to 50% for 10-pair scanner. Single forum report, not independently replicated. User-reported 12 to 15% CPU per currency pair for poorly coded scanner EA. Single report. User-reported 80% CPU and 3 GB RAM on Core i7 6700 for multi-symbol multi-period scanner. Single report.
- MQL5 Forum. Multitimeframe indicator memory: “a simple multitimeframe indicator with no buffers needs 30 MB after calls to ArrayCopyRates.” MT5 caching multiplier of 2 to 5x inferred from multiple reports, not systematically benchmarked.
- ForexFactory Forum. Candlestick EA developer: backtesting showed “either very small profits or small losses” for candlestick patterns alone. User consensus: confluence with support/resistance is required for actionable signals.
- arXiv. Academic comparison of rule-based versus CNN-based candlestick pattern detection. Rule-based detection on time-series data outperformed CNN in most benchmarks. YOLO achieved 80% accuracy but researchers concluded rule-based approach was superior.
- FXVPS.biz. Market Watch cleanup yielding 20 to 40% CPU reduction. Single commercially interested source, not independently verified. VPS tier baselines from WinnerVPS, MassiveGRID, AccuWebHosting, and FXVM used for cross-article consistency.
Editorial Note
This article covers the deployment and resource planning of candlestick pattern scanner EAs on VPS infrastructure. It does not constitute financial advice, trading strategy guidance, or a recommendation of any specific scanner product, pattern type, or candlestick-based trading approach.
Community evidence on candlestick pattern reliability is directly relevant to infrastructure planning and is included for that reason, not as trading advice. The documented consensus that candlestick patterns alone produce inconsistent results is what drives the recommendation for confirmation indicators, which in turn determines whether a 2 GB or 4 GB VPS is the appropriate tier. Signal quality and infrastructure requirements are connected.
Memory estimates throughout this guide are reference ranges for infrastructure planning, not guaranteed specifications. The MT5 internal caching multiplier of 2 to 5x is inferred from multiple forum reports but has not been systematically benchmarked. Actual scanner memory consumption varies by product implementation, max bars setting, number of confirmation indicators, and MT4/MT5 build version. The “80 symbols x 9 timeframes on an average PC” performance claim from Amir Atif is vendor marketing and has not been independently verified.
VPS provider figures cited in this guide (FXVPS.biz, WinnerVPS, MassiveGRID) are commercially interested sources. The Market Watch CPU reduction figure of 20 to 40% is sourced from FXVPS.biz alone.