
A zone monitoring computation is a subtraction and a comparison: is the absolute difference between current price and zone boundary less than the alert threshold? That is the entire ongoing workload. Across 28 pairs with 50 active zones each, a full monitoring pass amounts to 1,400 floating-point operations, effectively instant on any hardware including the cheapest VPS available.
The infrastructure challenge is not computation. It is persistence. A supply zone on the daily chart can sit untested for two weeks before price approaches. The first retest is widely considered the highest-probability setup because resting orders are still waiting and most traders have not yet spotted the level. By the third or fourth approach, the zone loses power as the order pool thins. If the monitor is offline when price enters the approach threshold at 3:00 AM during the Asian session, the trader misses the only alert that zone may ever produce. A home PC running 16 hours per day misses 33% of all forex sessions. A Forex VPS running at 99.99% uptime misses 52.6 minutes per year.
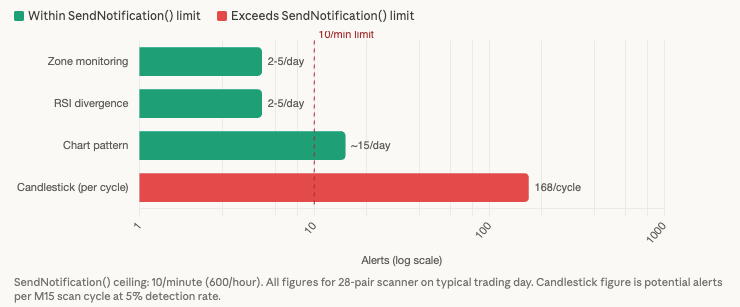
This makes zone monitoring the inverse of candlestick scanning: the lightest detection workload in the scanner article family combined with the longest dormant periods between signals and the highest cost of a missed alert. Where candlestick scanners overwhelm notification rate limits with hundreds of detections per cycle, a zone monitor produces 2 to 5 meaningful alerts per day on a swing trading setup.
This article covers the two-phase resource model (detection versus monitoring), alert architecture where reliability matters more than throughput, why pending orders do not replace zone monitoring, and VPS tier planning for the lightest scanning workload. Resource figures draw from MQL5 documentation, marketplace product data, forum benchmarks, and algorithmic complexity analysis. Single-source and commercially interested figures are flagged.
How zone detection and monitoring work as two separate workloads
The resource profile of zone monitoring splits into two phases with fundamentally different computational characteristics. Understanding this split is what separates informed VPS planning from guessing.
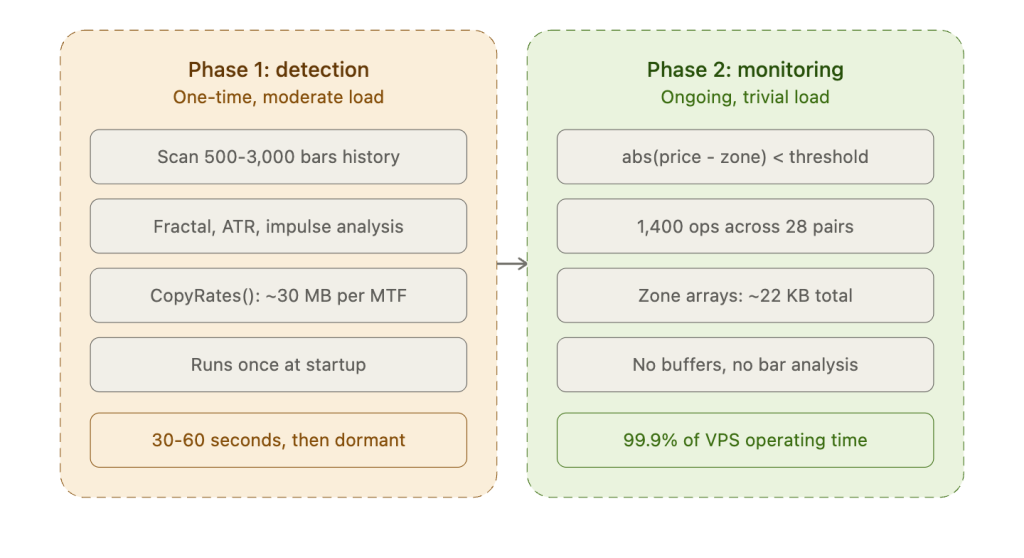
Phase 1 is detection: the algorithm scans historical price data to identify where supply and demand zones exist. This is the heavier phase, but it runs infrequently. Six distinct algorithmic approaches appear across MQL5 implementations. The fractal plus ATR method (used by the widely adopted Shved indicator) identifies swing highs and lows as fractal points, then uses ATR to determine zone width and classifies zones into five strength categories from weak to proven. Impulse-based detection (ExMachina, published March 2026) measures combined range across 2 to 3 consecutive bars and qualifies a zone when the move exceeds 1.0x ATR. Consolidation plus breakout detection (documented in MQL5 Articles Part 6) scans for consolidation ranges of at least 7 candles, detects the breakout, and validates by checking preceding candles for impulsive movement. RBR/RBD/DBR/DBD pattern classification categorizes candles as indecisive, decisive, or explosive based on body-to-range ratio, then identifies rally-base-rally and drop-base-drop sequences. ZigZag-based detection tracks highs and lows via the ZigZag indicator and derives supply and demand levels from the pattern. Each approach requires scanning 500 to 3,000 bars of historical data depending on the lookback parameter, performing array operations, ATR calculations, and pattern matching across that history.
The critical resource detail: detection runs once at indicator initialization and again only when new swing points form on higher timeframes. It does not run on every tick or every bar close. The ExMachina implementation explicitly uses a new-bar check (isNewBar) before processing, meaning the detection algorithm fires at most once per bar period. On D1, that is once per day. On H4, six times per day. Between those events, the detection code is dormant. Multi-timeframe detection via CopyRates() adds approximately 30 MB per MTF instance (based on a forum developer measurement of “a simple multitimeframe indicator with no buffers needs 30 MB after calls to ArrayCopyRates”), which is the primary memory cost during detection.
Phase 2 is monitoring: once zones are identified and stored, the ongoing computation is trivial. The monitor checks whether current price is within a configurable distance of any stored zone boundary. The entire operation is abs(current_price – zone_level) < threshold, a subtraction and a comparison on double-precision floating-point values. Zone storage consumes approximately 800 bytes per pair (50 active zones multiplied by 2 boundaries multiplied by 8 bytes per double), totaling roughly 22 KB across 28 pairs. No indicator buffers are maintained. No historical bar data is re-analyzed. No pattern matching occurs. The monitoring phase produces no measurable CPU load on any VPS tier.
This two-phase split has a direct VPS planning implication. The startup period (first 30 to 60 seconds after terminal launch) consumes moderate CPU and memory as zone detection runs across all monitored pairs and timeframes. Once detection completes, resource consumption drops to effectively zero for the monitoring phase. A VPS that feels “slow” during the first minute after a reboot or weekly restart but runs smoothly thereafter is exhibiting this exact pattern. The initial detection phase is the resource constraint, not the ongoing monitoring that constitutes 99.9% of the VPS’s operating time.
Compare this to the other scanning workloads in the article series. RSI divergence scanning recalculates indicator values on every bar close across 112 handles. Candlestick pattern scanning checks 25 to 30 pattern types on every bar close across 28 pairs. Both have ongoing computational loads that scale with bar frequency. Zone monitoring’s ongoing load does not scale with bar frequency because it operates on stored zone coordinates, not on incoming bar data.
What the MQL5 marketplace offers for VPS-based zone monitoring
The MQL5 marketplace has a deep ecosystem of supply and demand zone tools, but the vast majority are single-chart indicators designed for manual desktop trading. Only two products offer the multi-pair dashboard architecture that makes VPS deployment resource-efficient, and no product offers native Telegram integration.
The highest-rated S&D indicator is Advanced Supply Demand by Bernhard Schweigert: 4.91 stars with 355 reviews and 15,920 demo downloads, making it the most widely adopted product in the category. It is MT4 only, with rental pricing at $55 for 3 months or $88 per year. Features include proprietary zone detection with dual-timeframe nested zone display, a zone strength engine with adjustable sensitivity, and zone slicing for oversized zones. Three alert types cover the key monitoring scenarios: price enters zone, price breaks zone, and reversal candle forms from zone. The developer stated that the algorithm is too complex for dashboard mode, limiting it to single-chart operation. For VPS deployment across 28 pairs, this means 28 chart instances with the indicator attached to each, producing the standard per-chart memory overhead rather than the lightweight dashboard approach.
Blahtech Supply Demand by James Cater (4.58 stars, 43 reviews, $99 on both MT4 and MT5) is the most credible product for VPS resource claims. The developer explicitly states the indicator is “optimised to reduce CPU usage,” and this claim carries more weight than typical vendor marketing because Cater has 20+ years of professional banking IT experience at Barclays, Credit Suisse, and Merrill Lynch. A user review corroborates: “Despite packing tons of features, it’s lightweight and won’t slow down your MT4 platform.” The Order Block Indicator by Diego Arribas Lopez ($94, MT4 and MT5) includes a dedicated “Performance Mode” for lower-spec systems, directly relevant for VPS environments.
The most VPS-relevant product found is the Supply Demand Dashboard by Jan Flodin ($59 buy or $40 per year, MT4 and MT5). This is a purpose-built multi-symbol, multi-timeframe dashboard that monitors all selected Market Watch symbols from a single chart. It rank-sorts symbols by proximity to zones, uses an ATR-based offset parameter for approach alerts (genuine proximity alerting, not just touch alerts), includes RSI and divergence filters, and writes signals to global variables for EA auto-trading integration. The developer provides downloadable EA source code for iCustom() integration. It must be placed on an M5 chart on a clean, empty chart. The low review count (1 review, 43 demo downloads) suggests limited adoption despite a strong feature set.
The Basic Supply Demand indicator offers the best entry point for testing zone monitoring on a VPS. The base indicator is free, with a paid dashboard version that scans multiple symbols and ranks by proximity. It explicitly supports “alerts on approaching or breaking supply and demand zones,” confirming genuine approach alerting. Recommended for M1 and M5 timeframes.
On the automated trading side, Supply Demand EA Pro by Georgios Kalomoiropoulos (HPZ Trading) has the highest rating among S&D EAs at 4.95 stars with 22 reviews ($289, MT4). A user review provides the strongest independent VPS evidence in the research: “Supply and demand indicators are notorious for being CPU hogs as they are doing a ton of stuff on charts times 28 pairs your MT4 platform becomes SLOW. This EA is on almost all pairs at once and my platform is still fast.” The same developer’s ProBot ($589, MT4 and MT5) includes explicit VPS guidance in its FAQ: “A VPS is recommended for continuous trading.”
Alert architecture
Zone monitoring inverts the alert architecture problem that dominates the other scanner articles in this series. A candlestick scanner checking 30 pattern types across 28 pairs can generate 168 potential alerts in a single M15 bar close, overwhelming SendNotification() at 10 per minute. An RSI divergence scanner produces moderate frequency across 112 symbol-timeframe combinations. A zone monitor on a swing trading setup produces 2 to 5 meaningful alerts per day. The SendNotification() rate limit is not a constraint. The Telegram Bot API rate limit is not a constraint. The binding constraint is that each alert must fire reliably because the trader may have waited days for that specific zone approach.
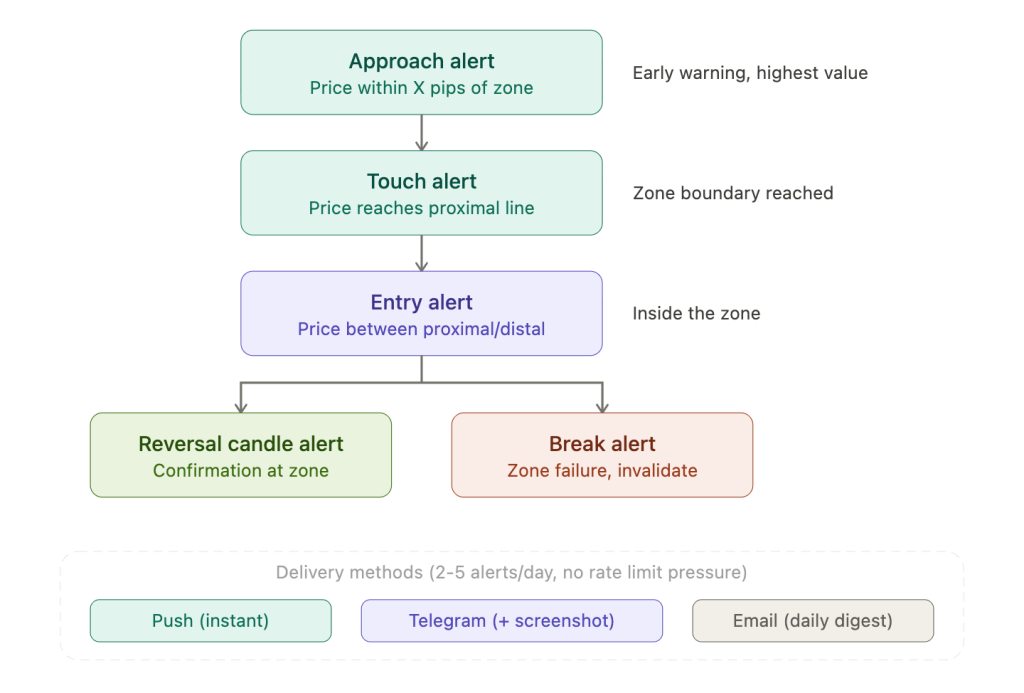
Five alert types form a natural hierarchy for zone monitoring, each serving a different purpose in the trader’s workflow. Approach alerts fire when price moves within a configurable distance of the zone boundary, providing early warning. This is the most valuable alert type for S&D traders because it gives time to evaluate zone quality, check confluence conditions, and prepare a trade plan before price reaches the level. The ExMachina implementation defaults to 50 points (5 pips on a 5-digit broker). The Supply Demand Dashboard by Jan Flodin uses an ATR-based offset that scales with current volatility, a more sophisticated approach because a 20-pip approach threshold on EUR/USD during the Asian session means something different than during London. Touch alerts fire when price reaches the zone’s proximal line. Entry alerts fire when price moves between the proximal and distal lines of the zone. Break alerts fire when price pushes through the distal line, indicating zone failure and the need to remove the invalidated level from monitoring. Reversal candle alerts, available in Advanced Supply Demand, fire when a specific candlestick pattern forms at or within the zone, combining proximity with confirmation in a single notification.
Push notifications via SendNotification() are the optimal delivery method for zone monitoring specifically because the alert frequency is low. Each notification carries high value per message (the trader has been waiting days for this signal), and push delivery is instant with no external dependencies. The 10-per-minute ceiling is irrelevant when the typical daily output is 2 to 5 alerts. Telegram via WebRequest() adds a capability that push notifications lack: chart screenshot delivery. ChartScreenShot() captures the chart with the approaching zone visible, and the Telegram Bot API’s sendPhoto endpoint delivers the image to the trader’s phone. Seeing the zone in context (its width, the quality of the preceding impulse move, proximity of other zones, candlestick behavior at the boundary) is substantially more useful than a text-only notification stating “EURUSD approaching demand zone at 1.0850.” Email serves as a backup logging mechanism, creating a searchable archive of all zone events. Daily digest emails consolidating all approach, touch, and break events across 28 pairs provide the end-of-session review that text notifications are too fragmented to deliver.
Alert deduplication is critical for zone monitoring because price often oscillates near the approach threshold. Without deduplication, a zone monitor sends repeated alerts every tick as price bounces around the boundary. The ExMachina implementation handles this by alerting only on fresh zones, avoiding re-alerts on zones that have already been tested. A common custom pattern uses a flag (global variable or array element) set when the alert fires and reset only when price moves more than twice the threshold distance away from the zone. This ensures the trader receives one alert per zone approach rather than dozens of identical notifications within minutes.
Why pending orders do not replace zone monitoring
The strongest counter-argument to VPS-based zone monitoring is that pending orders already solve the problem. A Buy Limit placed at a demand zone boundary is stored on the broker’s server, executes regardless of terminal status, and costs nothing in infrastructure. If the goal is simply to enter at the zone level, a pending order achieves this without a VPS, without an EA, and without any ongoing computation. The article would be dishonest not to address this directly.
Three documented limitations make pending orders insufficient for most zone trading workflows. The first is slippage on execution. MT4 does not support stop-limit orders. Its Buy Stop and Sell Stop orders are effectively market orders that trigger at a price level with no slippage protection. A ForexFactory thread documents a trader experiencing 40 pips of slippage on a pending order during NFP. MT5 partially addresses this with native stop-limit orders that convert to limit orders at the trigger price, adding a slippage control mechanism. But limit orders risk non-fill if the market gaps through the level, creating a different problem.
The second limitation is blind entry. A pending order cannot assess what is happening at the zone when price arrives. A zone that has been weakened by three prior approaches may not deserve a trade. A zone that price reaches during a news spike with widened spreads and withdrawn liquidity is a different setup than a zone approached during quiet London afternoon trading. FBS educational content warns that traders commonly “trade every zone the moment price touches it, even during the quiet Asian hours when volume is thin.” A pending order executes regardless of context. A zone monitoring EA can evaluate confluence conditions at the moment of approach: candlestick confirmation, RSI divergence, volume behavior, higher-timeframe alignment. The developer of the highest-rated S&D trading EA stated directly: “My intention was not to create an EA that will place random trades on all Supply and Demand Zones because that would not work.”
The third limitation is zone invalidation. Market structure can change between when a pending order is placed and when price reaches it. A higher-timeframe zone may be broken, a trend reversal may have occurred, or a fundamental shift may have invalidated the thesis behind the zone. The pending order remains active in a context that no longer supports the trade. A monitoring EA can incorporate invalidation logic: if the zone has been broken on a higher timeframe, suppress the alert and cancel the setup.
The practical spectrum for zone trading runs from no infrastructure (pending orders with blind entry risk) through basic infrastructure (zone monitor on VPS sends approach alerts, trader evaluates manually and decides) to advanced infrastructure (zone monitor with confluence filters and semi-automated execution on VPS). The middle option, a human-in-the-loop monitor, is the sweet spot. It justifies VPS investment without making aggressive automated trading claims. The infrastructure monitors price across all sessions. The trader makes the decision. This is the workflow that the marketplace products are converging on: automated detection and alerting with human trade execution.
VPS tier planning for zone monitoring
The two-phase resource model from the detection section translates into VPS requirements that are lower than any other scanning workload in this article series, but the specific tier depends on whether the trader draws zones manually or relies on automated detection.
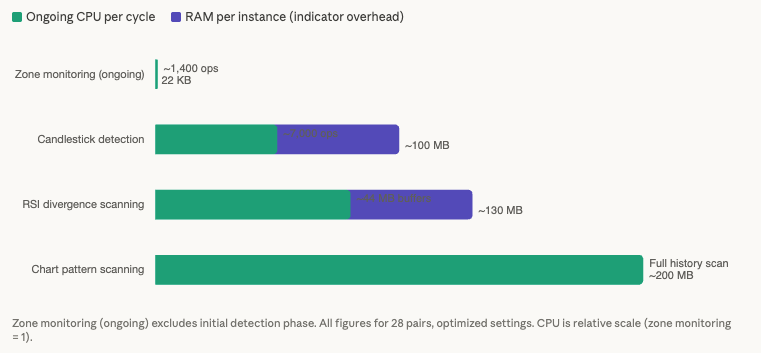
A monitoring-only setup where the trader marks zones manually and an EA watches for price proximity requires almost no resources beyond the terminal itself. Zone storage is approximately 22 KB for 28 pairs. CPU per monitoring cycle is 1,400 floating-point operations. The EA adds no indicator buffers, no historical bar processing, and no chart rendering overhead beyond the base terminal. On a 2 GB VPS with MT4 (Windows Server at 800 MB to 1.2 GB, MT4 baseline at 150 to 200 MB), the monitoring EA fits with ample headroom. The constraint at this tier is not the monitor but the number of charts: 28 charts with manually drawn zones produce the standard per-chart overhead of 30 to 50 MB each on MT4, totaling 840 to 1,400 MB. After Windows and the terminal baseline, 28 charts push past 2 GB. Reducing to 6 to 8 major pairs on 2 GB keeps the setup within safe margins.
An automated detection plus monitoring setup where the EA identifies zones algorithmically requires more memory during the startup detection phase. Each chart with a zone detection indicator carries the standard per-chart overhead (MT4 30 to 50 MB, MT5 40 to 70 MB), and multi-timeframe detection via CopyRates() adds approximately 30 MB per MTF instance. After detection completes, the ongoing monitoring load drops to the same negligible level as the manual setup. A 4 GB VPS comfortably handles 28 pairs with automated detection across D1 and H4 timeframes. After Windows (800 MB to 1.2 GB), an MT5 terminal (250 to 350 MB), and 28 charts with zone indicators (28 multiplied by 50 MB average equals approximately 1,400 MB), roughly 1.0 to 1.5 GB of headroom remains. This accommodates the detection startup burst, memory growth over the trading week, and the 25% free RAM buffer.
An 8 GB VPS supports the combined monitoring stack: zone monitor alongside a candlestick scanner and an RSI divergence scanner on the same VPS. Each scanning workload adds its own per-chart or per-handle overhead. A smarter architecture runs all three scanner types from a single dashboard-style EA per chart rather than attaching separate indicator instances to 28 charts three times. This consolidation significantly reduces the per-chart rendering and OHLC data overhead that dominates memory consumption.
The “monitoring VPS” concept distinguishes this workload from a trading VPS. A zone monitor that only sends alerts (no trade execution) does not require ultra-low broker latency. It does not need to be colocated with the broker’s data center. The alerts go to the trader’s phone, not to the broker’s matching engine. What it does require is uptime. The 99.99% availability that a VPS provides (52.6 minutes of downtime per year) versus the 90 to 97% availability of a home PC (263 to 876 hours of downtime per year) is the infrastructure argument for zone monitoring. A monitoring VPS can use a cheaper tier (2 to 4 GB RAM, 1 vCPU) because latency optimization adds no value to the alerting function. If the trader uses the same VPS for both monitoring and trade execution, all infrastructure requirements compound and the latency argument from the pillar article applies.
CPU planning for zone monitoring is straightforward. After the initial detection phase (which may spike one core for 30 to 60 seconds during startup), sustained CPU usage during monitoring is well under 5% even with 28 pairs. The 80% max CPU sustained ceiling from the cross-article rules is relevant only during the detection phase or if multiple scanner types run simultaneously. For a zone-only monitoring VPS, CPU is never the constraint. RAM from per-chart overhead and uptime are the two variables that determine the tier.
Zone persistence through VPS reboots
Zone monitoring has a persistence requirement that no other scanning workload in this series shares. RSI divergence scanners recalculate indicator values from historical data on every startup. Candlestick scanners check current and recent bars without stored state. A zone monitor, particularly one using manually drawn zones, must preserve the trader’s zone markings through terminal restarts, VPS reboots, and the weekly maintenance cycle. If the zones disappear after a reboot, the monitoring EA has nothing to monitor.
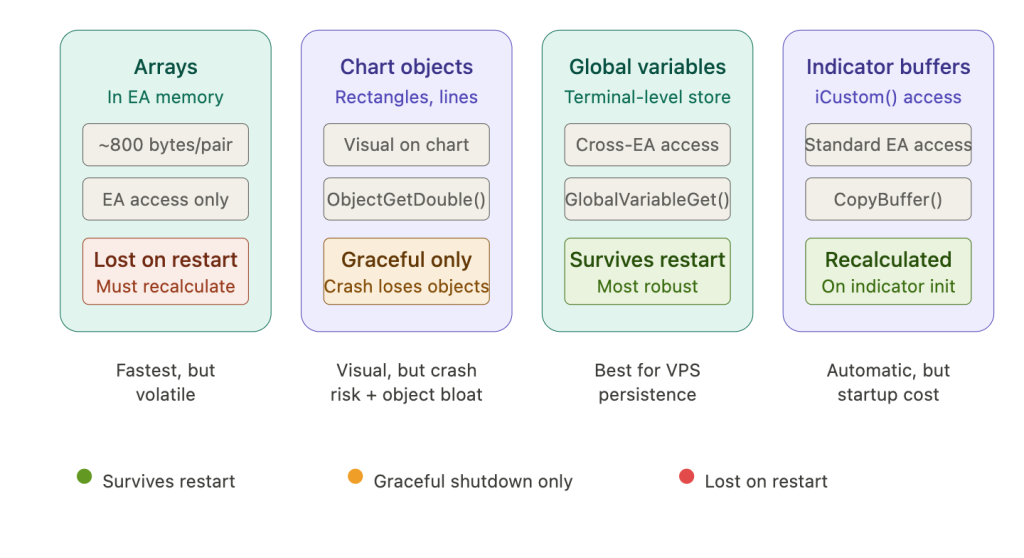
MetaTrader stores chart objects (rectangles, horizontal lines, trendlines) in chart profile files (.chr) located in MQL5\Profiles\Charts\ or the active profile folder. These profiles auto-save the current chart state, and chart objects persist through graceful terminal shutdowns. The critical caveat, documented in MQL5 forum discussions: “A crash of MT4 will make you lose all newly added chart objects.” No built-in method exists to force a chart profile save from MQL code. A graceful shutdown (closing the terminal normally or using a scheduled shutdown command) writes the profile. A crash, power failure, or forced process termination does not. For VPS deployments, this means the weekly restart should use a clean shutdown command (taskkill /im terminal64.exe followed by a delay, then restart) rather than a forced kill. The scheduled shutdown /r /f /t 60 command for weekly reboots gives the terminal time to save profiles before Windows restarts.
Portable mode (terminal64.exe /portable) simplifies zone persistence by keeping all data in a single self-contained directory. Profile files, chart templates, indicator settings, and zone objects all reside within the installation folder rather than scattered across AppData paths. This makes backup straightforward: copy the entire portable directory to cloud storage after the weekly maintenance window. If a catastrophic failure corrupts the profile, restoring from backup recovers all zone markings.
For EAs that read user-drawn zones programmatically, the documented approach (MQL5 Articles Part 24) uses ObjectGetDouble() with the chart object name as an input parameter to read zone boundaries. ChartID() ensures the correct chart when multiple charts are open. A known MT5 stability issue: ObjectFind() can produce random error 4202 (object exists but function fails to find it), potentially causing chart freezes. The recommended workaround is adding Sleep() between ObjectCreate and ObjectFind calls. On a VPS running unattended, this error can silently prevent the EA from reading zone levels, making the monitor appear operational while missing zone approaches.
Zone indicators that store levels in global terminal variables (the Shved indicator supports this via a “Set terminal global variables” parameter) provide the most robust persistence. Global variables survive terminal restarts by design and are accessible to any EA on the terminal via GlobalVariableGet(). Indicator buffer storage (accessible via iCustom) is recalculated on restart, so persistence is inherent in the indicator’s initialization logic rather than dependent on chart profile saving.
The chart object accumulation problem affects zone monitoring more than other scanning workloads because zone indicators continuously create rectangle objects as new zones form. Over weeks of continuous VPS operation, indicators that do not auto-remove broken or expired zones accumulate thousands of chart objects, causing progressive terminal slowdown. MQL4Solutions identifies this as a top-3 cause of MT4 terminal freezing. Configure the indicator to auto-remove zones older than a defined number of bars, or implement periodic ObjectsDeleteAll() cleanup in the weekly restart script. Non-repainting indicators like Ace Supply Demand Zone are preferable for unattended VPS operation because zone boundaries do not shift after detection, keeping alert thresholds reliable across the monitoring period.
Scanner-specific VPS optimization
The general VPS optimizations covered in our MT4 optimization guide apply to zone monitoring deployments, but the two-phase resource model creates a unique optimization priority: reducing the initial detection burden rather than the ongoing monitoring load.
Lookback depth is the highest-impact setting for zone monitoring. Default lookback values across marketplace products range from 500 to 3,000 bars, with some indicators defaulting to 3,000. During the detection phase, the algorithm scans every bar in the lookback window, performing fractal identification, ATR calculations, and impulse classification. Reducing lookback from 3,000 to 500 to 1,000 bars cuts the detection startup time proportionally. The free S&D levels indicator on MQL5 Code Base explicitly notes: “For slower computers a value of 500-1000 can be more suitable” for the back-bars parameter. On D1 charts, 500 bars covers roughly 2 years of trading data, more than sufficient for identifying active zones that price might retest. Zones older than 2 years have likely been tested multiple times and lost their significance.
Max bars in chart remains important but matters differently than for indicator-based scanners. RSI divergence scanners consume indicator buffer memory proportional to max bars (the 40x reduction from 512,000 to 5,000 documented across the series). Zone indicators that use chart object storage (rectangles rather than buffers) are less sensitive to max bars because the zone coordinates are stored as object properties, not as per-bar buffer entries. However, the underlying OHLC data still loads based on max bars, and chart rendering overhead scales with visible bar count. Set max bars to 5,000 to 10,000 per the cross-article recommendation.
Market Watch cleanup to only monitored symbols yields the documented 20 to 40% CPU reduction (sourced from FXVPS.biz, flagged as a single commercially interested source). For a zone monitor watching 28 pairs, the Market Watch should contain exactly those 28 symbols.
Chart object cleanup deserves more attention for zone monitoring than for any other scanning workload. Zone indicators create rectangle objects continuously as new zones form on each timeframe. Unlike indicator buffers that are managed by the terminal, chart objects persist indefinitely unless explicitly deleted. Configure the indicator to auto-remove zones that have been broken or zones older than a defined bar count. If the indicator does not support auto-removal, schedule an ObjectsDeleteAll() call as part of the weekly restart routine, followed by allowing the indicator to re-detect current zones from scratch during the startup phase.
The weekly restart itself serves a dual purpose for zone monitoring. It clears the accumulated chart objects and memory growth that both MT4 and MT5 exhibit during extended operation, and it forces a fresh detection pass that identifies any new zones that formed during the week. Schedule the restart for Saturday morning, before Sunday’s market open, so the terminal has time to complete zone detection before the first candle of the new week.
FAQ
Can I just use pending orders instead of a VPS zone monitor?
Pending orders work for simple zone entry but cannot assess context at the moment of execution. A Buy Limit at a demand zone fires regardless of whether the zone has been weakened by prior approaches, whether a news event has widened spreads, or whether higher-timeframe structure has invalidated the setup. The pending-orders-vs-monitoring section above covers three specific limitations with documented evidence. The practical sweet spot for most zone traders is automated monitoring with manual trade decisions: the VPS watches 28 pairs across all sessions and sends an alert when price approaches a zone, and the trader evaluates the setup and decides whether to enter.
Will my manually drawn zones survive a VPS reboot?
Yes, if the terminal shuts down gracefully. MetaTrader saves chart objects (rectangles, horizontal lines) to chart profile files (.chr) during a normal shutdown. A crash or forced process kill can lose recently added objects. Use a clean shutdown command in the weekly restart script rather than a forced kill. Portable mode simplifies backup: copy the entire installation directory to cloud storage after each maintenance window. If a corrupted profile loses zone markings, restoring from backup recovers them. For maximum reliability, use a zone indicator that stores levels in global terminal variables (the Shved indicator supports this), which persist through restarts independently of chart profile saving.
Can I run a zone monitor on the MetaQuotes built-in VPS?
The MetaQuotes VPS ($12.80 to $15 per month) can run a zone monitoring EA if the EA does not require DLL support. The 3 GB RAM ceiling is more than sufficient for the monitoring workload itself. The limitation that matters most for zone monitoring is alert reliability: multiple users report push notifications failing when the local terminal is closed, which is an architectural constraint of the built-in service for certain alert configurations. On a full Windows VPS, MetaTrader runs natively and push notifications work reliably because the terminal is always active. If the EA requires Telegram alerts via WebRequest() with DLL-based libraries, the MetaQuotes VPS cannot support it. For a simple zone monitor using only SendNotification() for push alerts, the built-in VPS works but should be tested thoroughly before relying on it for multi-day zone monitoring.
How do I combine zone monitoring with an RSI divergence scanner on the same VPS?
On a 4 GB VPS, both fit if they use the dashboard architecture (single chart per scanner type). The zone monitor adds approximately 50 to 150 MB of indicator overhead for automated detection across 28 pairs. The RSI divergence scanner adds 110 to 150 MB of indicator handle overhead. Combined scanner overhead is approximately 160 to 300 MB. After Windows (800 MB to 1.2 GB) and one MT5 terminal (250 to 350 MB), roughly 2.1 to 2.8 GB remains. Both scanners fit with headroom. On a separate terminal per scanner type, budget an additional 250 to 350 MB for the second MT5 instance. An 8 GB VPS handles this comfortably with room for a third scanning workload.
Is a 2 GB VPS sufficient for zone monitoring?
For a monitoring-only setup with manually drawn zones on 6 to 8 major pairs, yes. The monitoring EA itself adds negligible resource overhead (zone arrays in kilobytes, 1,400 floating-point operations per cycle). The constraint is per-chart overhead from the open charts, not the monitoring logic. On MT4 with 8 charts at 35 MB average, total consumption is approximately 1.3 to 1.7 GB (Windows plus terminal plus charts), leaving 300 to 700 MB of headroom. Reducing max bars to 5,000 and cleaning Market Watch to only monitored symbols keeps this within safe margins. For 28 pairs with automated zone detection indicators, 2 GB is too tight. The per-chart overhead alone (28 charts at 35 to 50 MB) exceeds available memory after Windows and the terminal baseline. A 4 GB VPS is the minimum for 28-pair automated detection.
References
- MetaQuotes Software Corp. MQL5 Reference: ObjectGetDouble() function. Reads price values from chart objects by name and property index. Used for EA access to user-drawn zone rectangles. Known issue: ObjectFind() can produce random error 4202 on MT5 (object exists but function fails to find it). Workaround: add Sleep() between ObjectCreate and ObjectFind calls.
- MetaQuotes Software Corp. MQL5 Reference: GlobalVariableGet() and GlobalVariableSet() functions. Terminal-level persistent storage surviving restarts. Used by Shved indicator for cross-EA zone level sharing.
- MetaQuotes Software Corp. MQL5 Reference: SendNotification() function. Rate limits of 2 calls per second and 10 per minute. Not a binding constraint for zone monitoring workloads producing 2 to 5 alerts per day. Multiple users report notification failures on the MetaQuotes built-in VPS when local terminal is closed.
- MetaQuotes Software Corp. MQL5 Articles Part 6: “Automating Trading Strategies in MQL5.” Allan Munene Mutiiria. Documents consolidation plus breakout zone detection: minimum 7-candle consolidation, breakout validation via 3 preceding candles. Processing runs only on new bar formation (isNewBar check).
- MetaQuotes Software Corp. MQL5 Articles Part 24. Documents EA reading user-drawn chart objects via ObjectGetDouble() with object name as input parameter. ChartID() for multi-chart disambiguation.
- Schweigert, B. Advanced Supply Demand. MQL5 Market, MT4, $55/3 months or $88/year rental. Rated 4.91 stars, 355 reviews, 15,920 demo downloads. Highest-rated S&D indicator. Dual-timeframe nested zones, zone strength engine, zone slicing. Three alert types: price enters zone, price breaks zone, reversal candle at zone. Single-chart only; developer stated algorithm too complex for dashboard mode.
- Cater, J. (Blahtech Limited). Blahtech Supply Demand. MQL5 Market, MT4/MT5, $99. Rated 4.58 stars, 43 reviews. Developer claims “optimised to reduce CPU usage.” Developer has 20+ years professional banking IT experience (Barclays, Credit Suisse, Merrill Lynch). User review: “Despite packing tons of features, it’s lightweight and won’t slow down your MT4 platform.”
- Arribas Lopez, D. Order Block Indicator. MQL5 Market, MT4/MT5, $94. Includes dedicated “Performance Mode” for lower-spec systems. User review: “No performance issues either the PC or the indicator.”
- Flodin, J. Supply Demand Dashboard. MQL5 Market, MT4/MT5, $59 buy or $40/year. Multi-symbol, multi-timeframe dashboard scanning all Market Watch symbols from single chart. ATR-based proximity alerts, rank-sorting by distance to zones, global variable output for EA integration, downloadable EA source code. Must run on M5 chart, clean chart. 1 review, 43 demo downloads.
- Kalomoiropoulos, G. (HPZ Trading). Supply Demand EA Pro. MQL5 Market, MT4, $289. Rated 4.95 stars, 22 reviews. User review: “Supply and demand indicators are notorious for being CPU hogs… This EA is on almost all pairs at once and my platform is still fast.” Supply Demand EA ProBot. MT4/MT5, $589. FAQ states: “A VPS is recommended for continuous trading.”
- Movaghar, B. Shved Supply and Demand (MT5 version). MQL5 Code Base, free. Fractal plus ATR zone detection with five strength categories. Stores zone levels in terminal global variables for cross-EA access and in indicator buffers for iCustom() consumption. Push notification support.
- ExMachina SupplyDemand. MQL5 Code Base, free, published March 2026. Impulse-based detection with ATR filtering, zone merging, touch tracking, freshness tracking. Default lookback 1,000 bars. Proximity alerts at configurable distance (default 50 points). Processes only on new bars (isNewBar check). Alerts only on fresh zones for deduplication.
- Basic Supply Demand. MQL5 Market, free base indicator with paid dashboard. Dashboard scans multiple symbols, ranks by proximity. Explicitly supports “alerts on approaching or breaking supply and demand zones.” Recommended for M1/M5 timeframes.
- MQL5 Forum. Developer measurement: “a simple multitimeframe indicator with no buffers needs 30 MB after calls to ArrayCopyRates.” Single forum report, not independently verified. Establishes memory overhead for CopyRates-based MTF detection.
- MQL5 Forum. Chart object persistence: “Please shut terminal.exe down (closing it) before making a backup. This makes sure that the last things written or done on the chart are written to the files.” Separate thread: “A crash of MT4 will make you lose all newly added chart objects.”
- MQL5 Forum. Zone monitoring demand from manual trader: “I trade manually. I just need the price alert… Today I rented VPS from MQL5 with hopes that I will be able to receive push notifications when I turn off my computer. But after migrating the data… I still stop receiving notifications.” Demonstrates both real demand and MetaQuotes VPS limitation.
- MQL5 Forum. Multi-symbol scanner resource evidence: developer scanning 600 symbols with Bars() call reported “all cores on my i7 8700k CPU into 100% usage for up to 3 minutes.” Solution: store results in arrays, check for updated data per symbol before processing.
- ForexFactory Forum. Pending order slippage: thread #456479 documents 40 pips slippage on pending order during NFP. “MT4 doesn’t support Stop-Limit orders. MT4 just has a basic Buy-Stop and Sell-Stop order, which is effectively a market order without any slippage control.”
- ForexFactory Forum. HPZ Trading developer hpztrading: “My intention was not to create an EA that will place random trades on all Supply and Demand Zones because that would not work.” Also: “I trade both sessions” (London and Asian), confirming zone tests across all sessions.
- FBS (educational content). S&D zone retest dynamics: “The first retest often gives the sharpest move. Fresh resting orders are still waiting… By the third or fourth go, the zone loses power.” Warning on blind zone entries: “Many traders fall into the same traps. They trade every zone the moment price touches it.”
- EarnForex. “It is recommended to set up alerting indicators and expert advisors on a MetaTrader instance running on a VPS” for reliable notification delivery.
- MQL4Solutions. Identifies chart object accumulation as a top-3 cause of MT4 terminal freezing. Root cause: “The most common cause of a slow, frozen or lagging MT4 terminal is a custom indicator that runs very slowly… a loop that goes over a larger and larger number of bars as time goes on.”
- FXVPS.biz. Market Watch cleanup yielding 20 to 40% CPU reduction. Single commercially interested source, not independently verified. Cross-article consistent flagging.
Editorial Note
This article covers the deployment and resource planning of supply and demand zone monitoring EAs on VPS infrastructure. It does not constitute financial advice, trading strategy guidance, or a recommendation of any specific zone indicator, detection algorithm, or S&D trading approach. Whether supply and demand zones produce profitable trading results is a trading question outside the scope of this article.
The two-phase resource model (detection versus monitoring) is derived from algorithmic complexity analysis of six documented implementations. Actual resource consumption varies by indicator product, lookback depth, number of monitored pairs and timeframes, and MT4/MT5 build version. The “30 MB per MTF instance” figure from CopyRates() is a single forum report and has not been systematically benchmarked.
Zone alert frequency estimates (2 to 5 per day on a swing setup) are based on the temporal characteristics of D1 and H4 zones and community trading patterns, not on statistical measurement across a controlled sample. Actual alert frequency depends on market conditions, zone detection sensitivity, and approach threshold settings.
MQL5 marketplace product descriptions are vendor-provided. The “optimised to reduce CPU” claim from Blahtech is developer self-report, partially corroborated by an independent user review. VPS provider figures cited in this guide (FXVPS.biz) are from a single commercially interested source.