
A hammer pattern is six arithmetic operations on a closed candle’s OHLC values. The detection itself is trivial. What makes it an infrastructure problem is that MetaTrader has no “candle close” event. An EA can only confirm a completed candle when the first tick of the next bar arrives, and that tick competes with thousands of other EAs firing simultaneously at the period boundary. Miss it by a few seconds on a liquid pair and the entry price is fine. Miss it by 30 seconds on a thin cross during Asian session and the setup may no longer exist.
This is not a speed problem in the way scalping is a speed problem. Sub-millisecond latency does not help here. The requirement is reliability: the EA must be running, connected, and processing ticks at the exact moment the bar rolls over. A home PC that sleeps at 3 AM, loses Wi-Fi for 40 seconds, or reboots for a Windows update fails this requirement in ways that a VPS does not.
This article covers the infrastructure side of running reversal pattern EAs (hammers, pin bars, engulfing candles) on a VPS. It examines how MQL4/MQL5 code detects these patterns, why the candle-close moment creates a timing bottleneck, how broker server time affects which candles form, what VPS clock drift does and does not affect, and practical resource sizing for single-pair and multi-symbol scanning setups. The focus is on what happens between the pattern forming and the order filling, not on whether hammer patterns work as a trading strategy.
Data is drawn from MetaQuotes documentation, MQL5 forum measurements, the MQL5 CodeBase and Market product ecosystem, ForexFactory community reports, and VPS provider benchmarks. Where figures come from commercially interested sources, that relationship is noted.
How Reversal Pattern EAs Detect Hammers and Pin Bars in MQL
The detection logic for hammers and pin bars reduces to four derived values from a completed candle’s Open, High, Low, and Close. In MQL4, EAs access these through predefined arrays (Open[1], Close[1], High[1], Low[1]) or the iOpen()/iClose() function family for cross-symbol queries. In MQL5, the preferred approach is CopyRates(), which copies MqlRates structs containing open, high, low, close, time, volume, and spread into an array. MetaQuotes community consensus holds that CopyRates() is faster or equal to the iXXX functions and is strongly preferred for multi-symbol EAs.
The four values every hammer EA computes are straightforward. Range equals High minus Low, giving the total candle size. Body equals the absolute value of Close minus Open. UpperWick equals High minus whichever of Open or Close is greater. LowerWick equals whichever of Open or Close is smaller, minus Low. From these four numbers, the EA checks whether the lower wick exceeds a multiple of the body size (typically 2x), whether the body sits in the upper portion of the total range (typically the upper third), and whether the candle meets a minimum size threshold to filter noise.
The most common wick-to-body ratio across community implementations is 2.0. The Mark Falzon Pinbar Signal EA on MQL5 Forum uses Tail_ratio=2.0 as its default. MetaQuotes’ own CCandlePattern::CheckPatternHammer() in the Standard Library takes a geometrically equivalent but differently formulated approach: it checks whether MathMin(Open(1),Close(1)) is greater than High(1) minus one third of the range. This confirms the body sits in the upper third without computing an explicit ratio. The two methods flag different candles at the margins, which is a notable source of divergence between community EAs and the official library. Traders running both will occasionally see conflicting signals from the same price data.
The EarnForex Pinbar Detector, one of the most widely used free implementations with over 36,000 views on MQL5 CodeBase, exposes nine configurable parameters. These include MaxNoseBodySize (default 0.33), NoseBodyPosition (0.4), and LeftEyeMinBodySize (0.1). This reflects the three-bar pin bar model, which treats the left eye, nose, and right eye as distinct components. It is functionally different from the simpler single-bar hammer model. The single-bar model evaluates one candle in isolation. The three-bar model requires the middle candle’s wick to protrude beyond both adjacent candles, adding two more comparison checks but also requiring three bars of confirmed data rather than one.
Additional filtering parameters commonly found in production EAs include minimum candle size (either a fixed pip value like 10 pips or ATR-based, with ATR-based considered more robust for adapting across instruments and volatility regimes), maximum candle size (e.g., 150 pips, filtering out news spikes that technically form hammer shapes but lack the institutional footprint traders associate with genuine reversals), and a requirement that one wick be 4 to 5 times the length of the other.
The universal confirmation rule across all implementations is the same: analyze bar[1] (the last completed candle), never bar[0] (the still-forming candle). MetaQuotes documentation explicitly states that OHLC values “are consistent except for bar zero.” Bar[0] updates with every tick, meaning its High, Low, and Close change continuously until the bar completes. Any pattern detected on bar[0] can appear, disappear, and reappear multiple times before the candle closes. The canonical entry pattern waits for the first tick of a new bar, evaluates the just-closed candle for a match, then enters at the current market price.
Multi-timeframe confirmation adds an infrastructure layer. A common setup checks for an H4 hammer confirmed by an M15 entry trigger. In MQL5, this works because CopyRates() accepts an independent timeframe parameter, and the terminal builds higher-timeframe bars from cached M1 data. The critical caveat, documented across multiple MQL5 forum threads: data for non-chart timeframes is not guaranteed to be synchronized on the first access. Best practice requires checking SeriesInfoInteger(symbol, tf, SERIES_SYNCHRONIZED) before using the data, and handling the case where it returns false by skipping the signal or retrying on the next tick.
One documented case on the MQL5 forum showed CopyHigh/CopyClose on daily bars returning data shifted by one full day between two VPS instances running the same EA on the same broker. Both were connected to the same account. Both received the same ticks. Yet the daily bar data was offset, producing opposite signals. This is a sobering reminder that multi-timeframe data access on a VPS requires defensive coding, not assumptions.
The Candle-Close Bottleneck: Why MetaTrader Has No “Close” Event
MetaTrader does not fire an event when a candle closes. The platform offers two event handlers relevant to price data: OnTick(), which fires on each new quote for the chart symbol, and OnTimer(), which fires at fixed intervals set by EventSetTimer(). Neither is tied to bar completion. A bar is considered closed only when the first tick of the next bar arrives, at which point the previous bar’s OHLC values become final and immutable. As MQL5 forum expert Fernando Carreiro states: “You can’t know when a candle closes. Only when a new tick arrives that starts a new bar is the old bar closed.”
This means a reversal pattern EA does not detect a hammer at the moment the candle finishes forming. It detects the hammer when the next candle begins. The gap between those two moments is the infrastructure bottleneck.
The canonical detection method uses a static datetime comparison inside OnTick():
static datetime lastbar = 0;
datetime curbar = (datetime)SeriesInfoInteger(_Symbol, _Period, SERIES_LASTBAR_DATE);
if(lastbar != curbar) { lastbar = curbar; /* new bar detected */ }
This is the only reliable approach. Two alternatives that appear in older code are demonstrably unreliable. Checking whether the Bars count has increased fails because a reconnection event changes the bar count without a new bar forming. Checking whether Volume[0] equals 1 (implying the first tick of a new bar) fails because ticks can be missed during fast market conditions, meaning the EA may never see Volume equal to 1 on the current bar. Community consensus across MQL5 forums and ForexFactory threads is unanimous on this point: time comparison is the correct method.
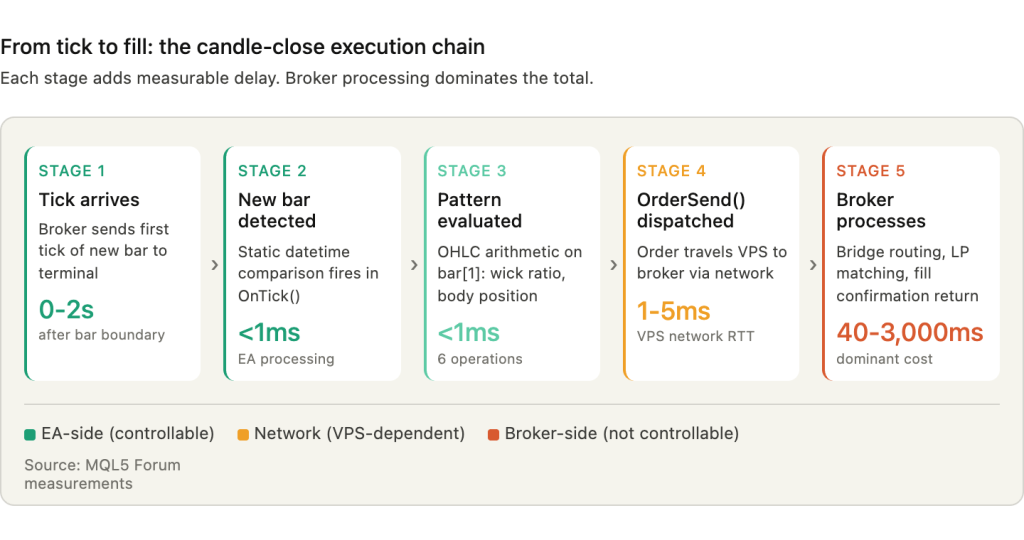
The execution window after candle close varies dramatically by instrument and session. On EURUSD during London or New York hours, the first tick of a new bar typically arrives within 0 to 2 seconds of the time boundary. Liquidity is deep, multiple providers are streaming quotes, and the terminal receives a tick almost immediately after the period rolls. On illiquid cross pairs or exotics during off-hours, the wait can stretch to seconds or even minutes. An EA attached to NZDJPY during early Asian session might not receive a tick for 15 to 30 seconds after the hourly boundary, delaying detection and entry proportionally.
The congestion at period boundaries is a distinctive infrastructure challenge that does not affect scalping or trend-following EAs in the same way. At every H1 candle close, thousands of EAs across all brokers evaluate the just-completed bar and fire orders simultaneously. One ForexFactory user described the phenomenon directly: “With the arrival of a new bar, a lot of advisers begin to trade, broker servers are under heavy load and get DOS-attacked by trading programs. The broker server refuses and causes requotes and failures.” This is not an exaggeration. Broker trade servers process a concentrated burst of OrderSend() calls within the first 1 to 3 seconds of each new hourly bar, and the resulting queue creates measurable delays and rejection rates.
Experienced EA developers have adopted a counterintuitive response to this problem: deliberately delaying execution by approximately 5 seconds after new bar detection. Rather than racing to be first in the queue, this approach lets the initial burst clear and submits the order into a less congested window. For candle-close strategies where the signal is the completed bar (not the first tick of the new bar), this delay costs almost nothing in terms of price movement on H1 or H4 timeframes but substantially reduces requotes and off-quotes errors. One developer reported that adding a 5-second Sleep() after new bar detection cut Error 136 (off quotes) occurrences by roughly 80% on an H1 EA running across 12 pairs.
The infrastructure implication is clear. A VPS does not need to be fast in the HFT sense. It needs to be present, connected, and processing at the moment the bar rolls over. A home PC that is asleep, disconnected, or mid-reboot at that moment produces no signal at all. The EA simply does not fire. And unlike a missed scalping entry where another opportunity arrives within seconds, a missed H4 hammer may not recur for days.
Broker Server Time and Its Effect on Pattern Detection
Most forex brokers set their MetaTrader server clock to GMT+2 in winter and GMT+3 in summer. This is not arbitrary. The offset aligns the daily candle close with 5:00 PM Eastern Time, which is the conventional end of the New York trading day and the standard daily reset for forex. The result is five clean daily candles per week, Monday through Friday, with no partial Sunday candle and no truncated Friday candle.
Brokers using GMT+0 (fixed UTC) produce a different candle structure from the same price data. The trading week starts with a small Sunday candle (typically 1 to 3 hours depending on the broker’s exact open time) and ends with a partial Friday candle. That is six daily candles per week instead of five. A hammer that forms on a GMT+2 broker’s Friday daily candle may not exist on a GMT+0 broker’s chart, because the OHLC values span different time windows. The pattern is not wrong on either broker. It is a different candle.
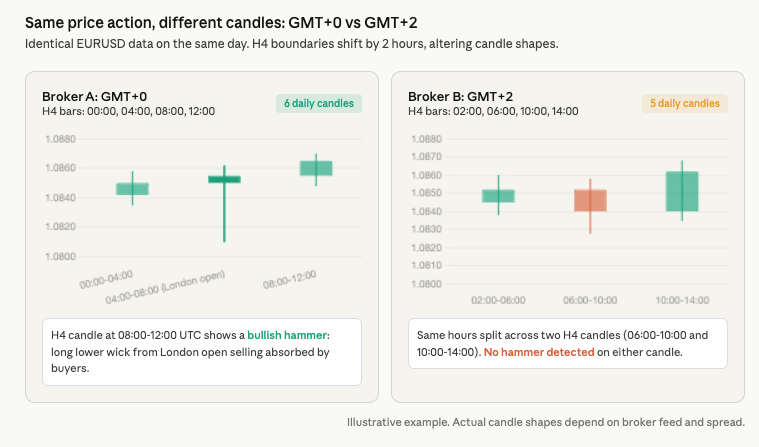
The divergence becomes more pronounced on sub-daily timeframes. H4 candle boundaries differ entirely between brokers. A GMT+0 broker’s H4 candles start at 00:00, 04:00, 08:00, 12:00, 16:00, and 20:00 UTC. A GMT+2 broker’s H4 candles start at 02:00, 06:00, 10:00, 14:00, 18:00, and 22:00 server time, which maps to 00:00, 04:00, 08:00, 12:00, 16:00, and 20:00 UTC only during winter. In summer, the GMT+3 offset shifts those boundaries by another hour. An H4 hammer detected at 10:00 on one broker’s chart may straddle two separate H4 candles on another broker’s chart, producing no hammer at all. Forum users have reported conflicting signals costing hundreds of pips when running the same EA logic on accounts with different broker time offsets.
For EA developers deploying on a VPS, this creates a concrete configuration requirement: the EA must either be coded for a specific broker’s server time offset, or it must calculate the offset dynamically and adjust its pattern detection accordingly. Hardcoding hour boundaries (e.g., “check for pattern at 08:00”) without accounting for the broker’s GMT offset will produce correct results on one broker and wrong results on another.
The DST transitions introduce a further complication. US Daylight Saving Time starts on the second Sunday of March and ends on the first Sunday of November. European DST starts on the last Sunday of March and ends on the last Sunday of October. During the 2 to 3 week gap in spring when the US has moved forward but Europe has not, brokers following US DST are already at GMT+3 while EU-referenced clocks remain on winter time. In 2026, this gap runs from March 8 to March 29 in spring, and October 25 to November 1 in fall. A ForexFactory thread documented the confusion directly: “Right now the times are 1 hour off still as NY changed clocks before Europe.”
For an EA running on a VPS, the practical risk is that killzone filters, session-based entry windows, and H4 boundary calculations all shift by one hour during these transition periods. An EA that trades only during London session hours using hardcoded server-time values will activate one hour early or late for 2 to 3 weeks twice per year unless the code accounts for the DST gap.
VPS Clock Drift: What Matters and What Doesn’t
The relationship between a VPS system clock and MetaTrader’s candle timing is widely misunderstood. The short version: VPS clock accuracy has no direct effect on candle-close detection when the EA is coded correctly. The longer version explains why, and why NTP configuration still matters for three other reasons.
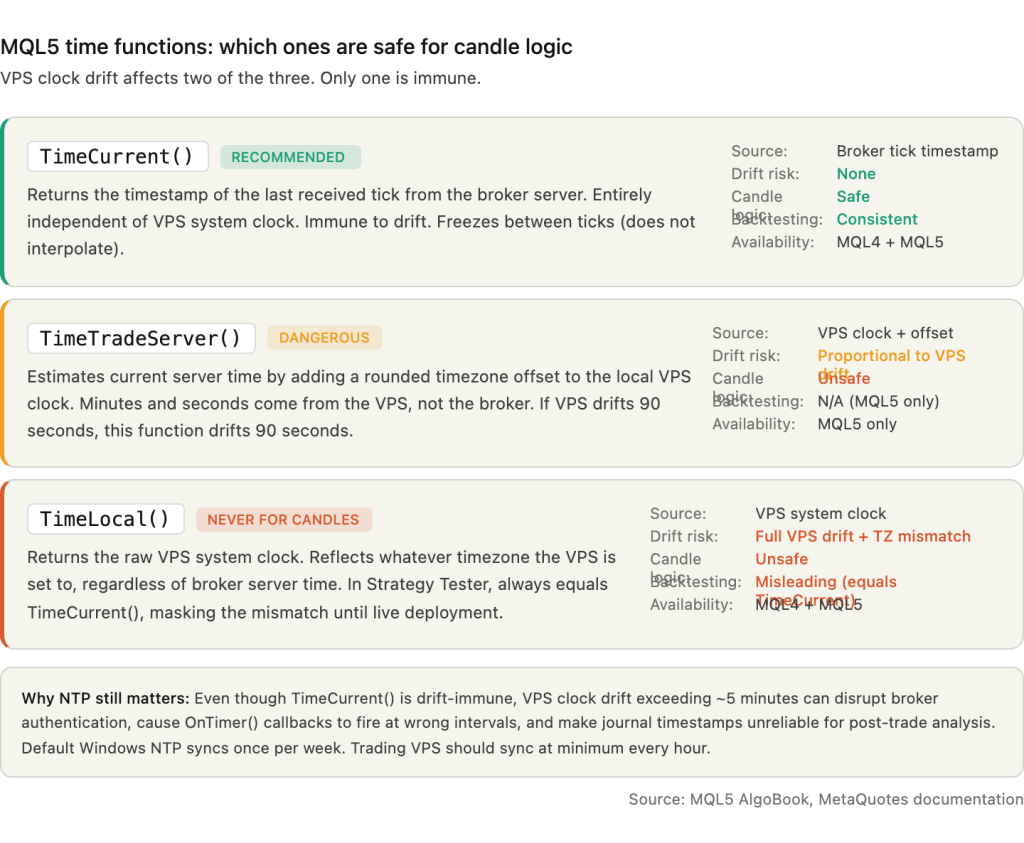
TimeCurrent() returns the last known broker server time. It is not derived from the VPS clock. The value is formed on the broker’s trade server and delivered with each incoming tick. If the VPS system clock drifts by five minutes, TimeCurrent() remains accurate because it reflects the timestamp attached to the most recent tick, not the local system time. The iTime() function behaves identically, returning server-timestamped bar open times. For candle-close detection using the static datetime comparison pattern (comparing iTime or SeriesInfoInteger against a cached value), VPS clock drift is irrelevant. The EA sees a new bar when the broker says a new bar exists, regardless of what the VPS clock reads.
TimeTradeServer() is the dangerous function. Available only in MQL5, it estimates the current server time by calculating the timezone offset between client and server, rounded to whole hours, then adding that offset to the local VPS time. The MQL5 AlgoBook documents this explicitly: “the standard approximation of server time will show the minutes and seconds of the client, not the server.” If the VPS clock drifts by 90 seconds, TimeTradeServer() drifts by 90 seconds. Any EA using this function for session filtering or killzone windows will activate at wrong times proportional to the drift.
TimeLocal() returns the VPS system clock directly and should never appear in candle-related logic. It also has a testing trap: in the Strategy Tester, TimeLocal() always equals TimeCurrent(), meaning an EA that uses TimeLocal() for session filtering will produce correct backtests but incorrect live behavior if the VPS timezone differs from the broker’s server timezone.
The recommendation for reversal pattern EAs is unambiguous. Use TimeCurrent() and iTime() for all candle-close detection and bar-timing logic. Both are server-time-based, immune to VPS clock drift, and consistent between live trading and backtesting.
Despite this, NTP configuration on the trading VPS still matters for three reasons that sit outside the candle-detection path.
First, OnTimer() events use the local clock for scheduling. If an EA uses OnTimer() as a fallback mechanism to check for new bars during low-liquidity periods (when ticks are sparse and TimeCurrent() freezes), the timer interval depends on the VPS system clock. A drifted clock causes timer callbacks to fire at irregular intervals, though the practical impact is small since timer-based checks are inherently approximate.
Second, VPS clock drift exceeding approximately 5 minutes can disrupt MetaTrader’s broker authentication protocol. One MQL5 forum user documented a VPS losing “1 to 3 seconds every 30 minutes,” which correlated with MT5 connection problems that resolved after installing clock synchronization software. The exact threshold at which authentication fails is not documented by MetaQuotes, but the anecdotal evidence suggests that drift in the single-digit-minute range triggers issues.
Third, log timestamps become unreliable with a drifted clock. MetaTrader journal entries and EA Print() output use a mix of server time and local time depending on the context. When the VPS clock is off by minutes, correlating journal entries with broker trade confirmations for post-trade analysis becomes difficult.
The default Windows Server NTP configuration syncs once every 604,800 seconds, which is once per week. Virtual machines are particularly susceptible to drift because the virtual clock can pause during VM migration, snapshots, and CPU contention events. Red Hat documented drift exceeding 120 seconds on VMware VMs under load. Steadfast Networks specifically notes that “trading applications in particular will cause clock drift on Windows systems” under sustained CPU pressure.
The recommended configuration uses multiple NTP sources with aggressive polling. Setting the W32Time service’s SpecialPollInterval registry value to 3600 (hourly sync) is the minimum for trading VPS. For tighter accuracy, setting MinPollInterval and MaxPollInterval to 6 produces a 64-second polling cycle. After configuration, verify with w32tm /stripchart /computer:pool.ntp.org /dataonly /samples:5 and confirm offsets remain consistently below 0.1 seconds.
Resource Requirements: Lighter Than You Think
Pattern detection EAs are among the lightest workloads you can run on a VPS. The computation itself, a handful of OHLC comparisons per candle close, consumes negligible CPU. There are no rolling indicator buffers to maintain, no moving average recalculations across thousands of bars, no Fibonacci projections or ZigZag traversals. The EA wakes up on each tick, checks whether a new bar has formed, runs six arithmetic operations if it has, and goes back to sleep. One experienced MQL5 developer reported running 60+ charts with 9 indicators each on MT4 using roughly 15% average CPU on a 4-core system with 109 MB of RAM and 10 MB/s disk throughput. A pattern EA with no indicators attached would register well below that.
The resource concern with reversal pattern EAs is not computation. It is data access.
The first CopyRates() call for a symbol not already loaded in Market Watch triggers a full history download from the broker server. One developer scanning 300+ stock CFDs via a timer-based loop reported all cores on an i7 8700K hitting 100% CPU utilization for up to 3 minutes during initial history loading. Once the data was cached, the same scan completed in under one second. For the typical 20 to 30 forex pair reversal scanner, the initial download phase is the only period of meaningful CPU load. After that, each subsequent new-bar check retrieves a single bar of cached data and finishes in microseconds.
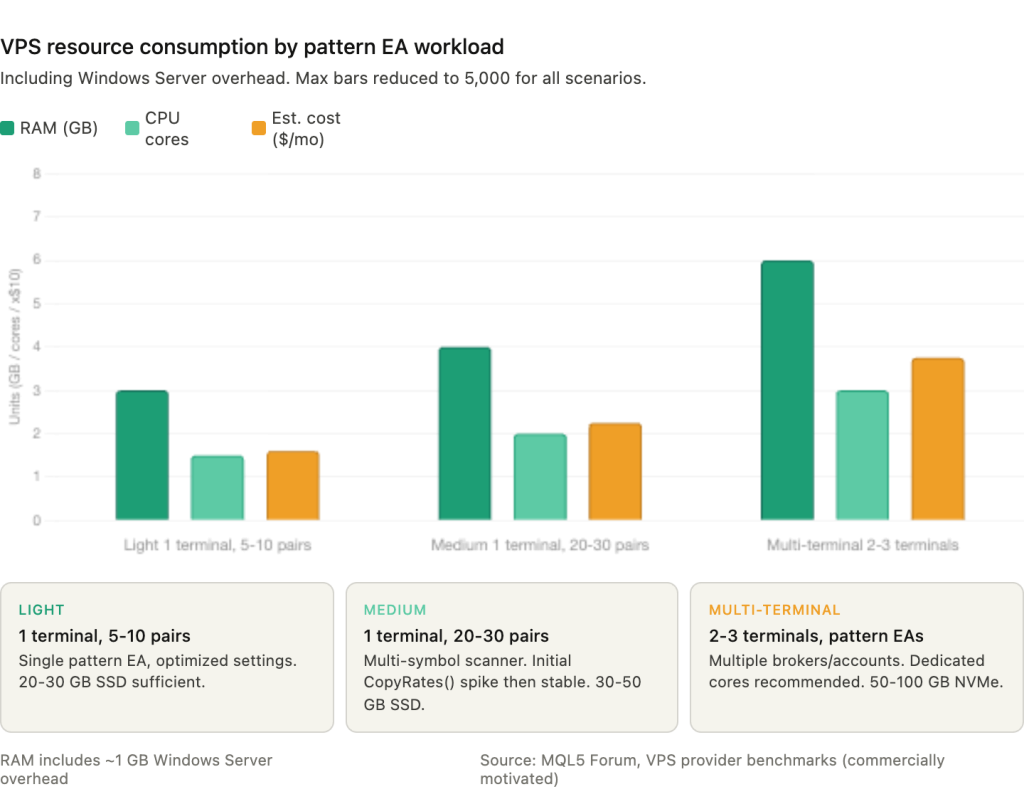
RAM consumption depends heavily on a single setting: “Max bars in chart” under Tools, Options, Charts. With the default value of 512,000 bars, a single MT4 terminal can consume over 1 GB of RAM. Reducing this to 5,000 bars, which is vastly more than the 2 to 3 bars of lookback a pattern EA actually needs, can drop memory to approximately 25 MB per terminal based on documented ForexFactory tests. This is the single most impactful optimization for pattern EA deployments. It costs nothing, takes ten seconds to configure, and can free hundreds of megabytes per terminal.
MT4 has a hard 2 GB per-process limit because it is a 32-bit application. With Windows Server consuming 800 MB to 1.2 GB at idle, a single MT4 terminal at default settings can push the system close to swap territory on a 2 GB VPS. MT5 uses more RAM at baseline (400 to 500 MB with community features enabled, dropping to 100 to 200 MB with those features disabled) but is 64-bit with no hard ceiling.
FXVPS.biz benchmark data, which should be noted as commercially motivated, shows active trading with 1 to 3 terminals averaging 10 to 30% CPU under normal conditions, with news events spiking utilization to 50 to 60%.
Practical RAM budgets including Windows Server overhead:
A single terminal scanning 5 to 10 pairs with max bars reduced to 5,000 runs comfortably on 2 GB, though 4 GB provides the headroom to avoid swap pressure. A single terminal covering 20 to 30 pairs needs 4 GB. Two to three terminals with pattern EAs across different brokers or accounts need 4 to 8 GB with 2 to 4 dedicated vCPU cores.
Storage requirements are minimal. Pattern EAs generate small log files and maintain no local databases. A 20 to 30 GB SSD handles one terminal. For multi-terminal setups, 50 to 100 GB NVMe accommodates the operating system, multiple MetaTrader installations in portable mode, and months of accumulated logs without cleanup.
MetaQuotes’ built-in VPS offers up to 3 GB RAM at $15 per month. For a single terminal scanning 20 to 30 pairs with optimized settings, this is sufficient. The critical limitation is that DLL calls are completely forbidden. Any EA using external libraries for news filtering, database logging, or custom math will fail immediately with a critical error. Multiple trading accounts also pose a problem: MetaQuotes VPS supports one account per subscription, so three accounts cost $45 per month versus $15 to 35 on a third-party VPS running all three.
OnTick() vs OnTimer(): The Architecture Decision
The choice between OnTick() and OnTimer() as the primary event handler determines how the EA interacts with VPS resources, how it behaves during low-liquidity periods, and whether it can be backtested reliably.
OnTick() fires on every new quote for the chart symbol. Combined with the static datetime new-bar check, it is the most reliable method for single-symbol pattern detection. The EA catches the first available tick after bar close, evaluates the completed candle, and either enters or passes. Between ticks, the EA consumes zero CPU. This approach works correctly in all Strategy Tester modes, making it the only option that produces consistent results across backtesting and live trading.
OnTimer() fires at fixed intervals set by EventSetTimer(seconds), independent of tick arrival. Its primary advantage is that it continues firing even when no ticks arrive, making it useful for two scenarios. First, multi-symbol scanning: an EA attached to one chart can loop through an array of symbols, calling CopyRates() for each, without needing ticks from those symbols. Second, low-liquidity fallback: on exotic pairs during off-hours where ticks may not arrive for minutes after a bar boundary, OnTimer() can detect new bars via iTime() checks that OnTick() would miss entirely.
The limitation is practical. OnTimer() does not work in the MT4 Strategy Tester. An EA that relies on OnTimer() for its core logic cannot be backtested on MT4 at all. On MT5, timer events do function in the tester, but the minimum resolution is approximately 10 to 16 milliseconds due to hardware timer limitations documented in the MQL5 reference.
The production hybrid combines both handlers:
int OnInit() { EventSetTimer(3600); return(INIT_SUCCEEDED); }
void OnTimer() { OnTick(); }
void OnTick() {
static datetime Time0;
if(Time0 == Time[0]) return;
Time0 = Time[0];
}
OnTick() handles the normal case. OnTimer() acts as a safety net, calling OnTick() once per hour to catch situations where ticks stopped arriving. The new-bar gate inside OnTick() prevents duplicate processing regardless of which handler triggered it.
For multi-symbol EAs, the architecture choice has direct VPS implications. Running one EA per chart means 28 currency pairs require 28 chart windows. Each chart consumes 30 to 50 MB of RAM on MT4 and 40 to 70 MB on MT5. The advantage is true parallelism: each EA runs in its own thread and processes ticks independently. A multi-symbol scanner running on a single chart loops through all symbols sequentially in one thread, using less RAM but blocking all symbols behind whichever one is currently being processed.
MQL5 forum expert Fernando Carreiro advises against the multi-symbol approach: “Do not trade multiple currencies in one EA. A multi-asset EA runs in one thread so that one asset blocks all the others.” His recommendation is to code each EA for a single pair and run on separate charts, leveraging the per-chart threading model that both MT4 and MT5 provide.
For VPS resource efficiency, the single-chart scanner is lighter. For execution reliability, separate charts per symbol is safer. The right choice depends on how many pairs the EA monitors and how tight the entry window needs to be. An H4 pattern scanner across 28 pairs tolerates the sequential blocking of a single-chart approach. An M15 scanner where a 2-second delay matters does not.
Disconnection Recovery and Defensive Coding
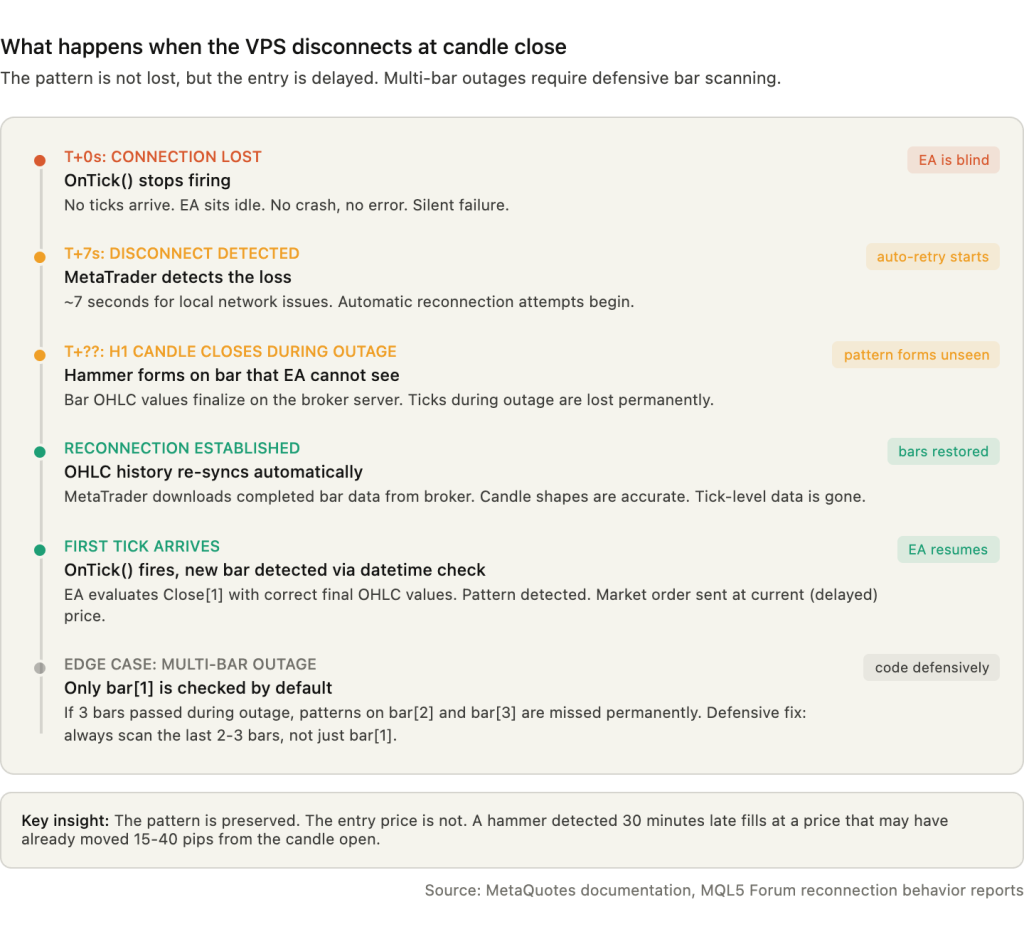
When the VPS loses its network connection or MetaTrader disconnects from the broker, OnTick() simply stops firing. No ticks arrive, no events trigger, and the EA sits idle. It does not crash, throw an error, or enter a broken state. It waits.
Upon reconnection, MetaTrader automatically re-downloads missed OHLC bar data from the broker server, reconstructing the complete candle history. The first incoming tick after reconnection triggers OnTick(), the static datetime comparison detects a new bar (because the cached lastbar value no longer matches the current bar time), and the EA evaluates Close[1] with correct final values. The pattern is not lost. But the entry is delayed by however long the disconnection lasted, and on a market order entry, that delay translates directly into a worse fill price.
MT4 and MT5 detect disconnection in approximately 7 seconds for local network issues and attempt automatic reconnection. Ticks that occurred during the disconnection are lost permanently. Only completed bar OHLC data is synchronized. This distinction matters: the EA will see accurate candle shapes after reconnection, but it will not know how price moved tick-by-tick during the outage.
A critical edge case affects multi-bar disconnections. If the VPS loses connectivity for two hours and misses three H1 bars, the EA evaluates only bar[1] on reconnection, which is the most recently completed candle. Patterns that formed on the intermediate bars (bar[2] and bar[3] at the time of reconnection) are permanently missed unless the EA explicitly scans multiple historical bars. The defensive recommendation is to always check at least the last 2 to 3 closed bars, not just bar[1]. The cost is trivial: two additional sets of OHLC comparisons per new-bar event.
Weekend gaps create a specific risk for Friday hammer signals. A bullish hammer forms on Friday’s daily candle. The EA detects it on Monday’s first tick and enters long at the current market price. But if the market gapped down over the weekend, the entry price may be 30 to 80 pips below Friday’s close, invalidating the setup entirely. The standard safeguard is a gap filter that compares the absolute difference between Close[1] and the current price (or Open[0] once the Monday bar begins forming) against a threshold, typically 0.5 times the 14-period ATR. If the gap exceeds the threshold, the signal is skipped.
Common MQL errors that appear specifically in reversal pattern EA deployments include Error 130 (invalid stops), Error 136 (off quotes), and Error 138 (requote).
Error 130 occurs when the calculated stop loss, usually derived from the candle’s wick extreme, falls within the broker’s minimum stop level distance from the current price. A small hammer on a pair with a wide minimum stop level triggers this reliably. The workaround for ECN brokers is to send OrderSend() with SL and TP set to zero, then immediately call OrderModify() to attach the stops after the position is open.
Error 136 occurs when the market has moved between pattern detection and order submission. The Ask or Bid price stored at the start of OnTick() processing is stale by the time OrderSend() executes. Calling RefreshRates() immediately before OrderSend() mitigates this, though it does not eliminate it during fast-moving conditions.
Error 138 (requote) is the broker rejecting the requested price and offering a new one. It concentrates at period boundaries when order volume spikes.
The recommended error handling pattern implements 3 to 5 retry attempts with RefreshRates() between each, a spread check before every attempt (comparing current spread against 2 times the normal spread to avoid entries during rollover widening), and full logging of each failure with timestamps for post-session review. After the final retry fails, the EA should abandon the signal rather than queue it. A hammer entry executed minutes after the candle close, at a price far from the bar’s open, is not the same trade the pattern identified.
Latency for Candle-Close EAs: Different Rules Than Scalping
Scalping EAs compete against market microstructure. Every millisecond of network latency changes the fill price because the market moves continuously and the EA races other participants for the same liquidity. Candle-close EAs face a different problem. They compete against other candle-close EAs for broker server capacity at the period boundary. The bottleneck is not how fast the order reaches the broker. It is whether the broker can process the order before the queue backs up.
Sub-5ms network latency is sufficient for virtually all candle-close pattern strategies. The practical advantage of a colocated VPS over a remote connection is not sub-millisecond fills. It is receiving the first tick of the new bar earlier than a remote trader, which means detecting the pattern earlier, submitting the order earlier, and reaching the broker’s order queue before the congestion peak.
A London-based VPS achieves 1 to 5ms latency to a London-based broker. A home internet connection from another continent adds 80 to 200ms. On an H1 bar close where the broker receives a concentrated burst of orders within the first 1 to 3 seconds, arriving 100 to 200ms earlier places the order ahead of thousands of competing submissions. Across hundreds of trades, this translates to consistently better queue position, fewer requotes, and slightly tighter fills.
However, broker processing time frequently exceeds network latency by an order of magnitude. MQL5 forum reports show OrderSend() round-trip times of 40 to 200ms under normal conditions, with some brokers reaching 300 to 3,000ms during peak periods. When the broker’s own processing takes 150ms, reducing network latency from 5ms to 1ms saves 4ms on a 150ms total. That is a 2.6% improvement in total execution time. Meaningful over thousands of trades, but not transformative.
This is fundamentally different from latency arbitrage or HFT, where network speed is the entire edge. For candle-close strategies, the edge comes from being present, connected, and submitting into a less congested window. The 5-second deliberate delay discussed in Section 3, where the EA waits for the initial burst to clear before submitting, reinforces this point. The optimal approach is not “as fast as possible.” It is “fast enough to be near the front, timed to avoid the worst congestion.”
The VPS value for pattern EAs is uptime and reliability, not raw speed. A 2ms VPS that drops connection twice a week is worse than a 10ms VPS with 99.99% uptime for this specific workload.
Deployment Checklist
MetaTrader cannot report its own failure. If the terminal crashes, loses internet, or the VPS reboots unexpectedly, the push notifications and email alerts that the EA normally sends stop working along with everything else. The EA is silent precisely when you most need to hear from it.
The first layer of defense is auto-restart after VPS reboot. The recommended approach combines Sysinternals Autologon (which configures automatic Windows login without requiring a stored plaintext password in the registry) with a MetaTrader shortcut in the Windows Startup folder. The shortcut should include the /portable flag so the terminal loads settings from its own directory rather than the user profile path. Windows Task Scheduler provides an alternative trigger using the “At startup” event, which fires before user logon completes. Stagger multiple terminal launches with 15-second delays between each to avoid overwhelming the VPS with simultaneous history downloads on boot.
The second layer is external monitoring. The FX Blue Dashboard Monitor runs on a separate server and continuously polls the trading VPS, alerting by email or SMS if the server becomes unreachable. A simpler approach uses a heartbeat file: the EA writes a timestamp to a local text file every few minutes via FileOpen()/FileWrite(), and a scheduled PowerShell script on an external machine (or a free UptimeRobot HTTP monitor checking a lightweight health endpoint) verifies the file is current. If the heartbeat goes stale, the alert fires outside the failed system entirely.
Windows Server optimization for trading VPS involves a short list of changes that collectively reduce resource contention and improve tick processing consistency. Set the power plan to “High Performance” to prevent CPU frequency scaling. Disable the Windows Search service (WSearch) to eliminate background indexing. Set Windows Update to manual-only or defer updates to weekends. Add the MetaTrader installation directories to Windows Defender exclusions to prevent real-time scanning of EA files and log writes. Under System Properties, Advanced, Performance Settings, set processor scheduling to “Background services” priority, which allocates more CPU time to non-foreground processes, including MetaTrader terminals running without an active RDP window.
MT4 terminals exhibit gradual memory growth during continuous operation, increasing from approximately 30 MB to 500 MB over four weeks in documented cases. Scheduling a weekly terminal restart during the weekend market close (Saturday or Sunday) prevents this accumulation from reaching swap territory. A simple Windows Task Scheduler job that kills and relaunches the terminal process at a fixed time each Saturday handles this without manual intervention.
FAQ
Can I run hammer and pin bar EAs on MetaQuotes’ built-in VPS?
Pure MQL pattern scanners with no external dependencies work without issues. The built-in VPS supports standard MQL4/MQL5 code, CopyRates(), iTime(), and all the OHLC functions pattern EAs rely on. The constraint that eliminates some setups is the complete prohibition on DLL calls. Any EA that imports an external library for news filtering (pulling calendar data from a web API), database logging, or third-party indicator integration will fail immediately with a critical error on deployment. If the EA is self-contained MQL with no #import statements referencing .dll files, MetaQuotes VPS handles it. If it calls anything outside the MQL runtime, it does not.
How do I find out which timezone offset my broker’s server uses?
Open MetaTrader, look at the time displayed in the Market Watch window header or on any chart’s time axis, and compare it to current UTC. The difference is the server offset. During winter months, most brokers show UTC+2. During summer (after DST transition), most show UTC+3. If the offset is UTC+0, the broker does not follow the New York close convention, and daily and H4 candle boundaries will differ from the majority of the market. There is no MetaTrader setting to view or change this. The broker sets it server-side, and the only way to confirm is observation or contacting broker support directly.
Should I use hidden stop losses managed by the EA instead of broker-side stops?
Some EA developers manage stops internally, closing positions only when a subsequent candle (often M5 or M15) closes past the intended stop level. This avoids stop-outs caused purely by spread widening during rollover or low-liquidity periods, where the spread momentarily exceeds the distance from entry to the wick-based stop loss. The trade-off is real: if the VPS disconnects or the EA crashes while a hidden stop is active, there is no broker-side protection at all. The position runs unprotected until reconnection. A middle-ground approach sets a wide broker-side emergency stop (e.g., 2x the intended stop distance) while the EA manages the tighter exit logic internally. This limits catastrophic loss during disconnections while still filtering out spread-spike stop hunts.
Do engulfing and other reversal patterns have different VPS requirements?
No. The infrastructure requirements are effectively identical. Engulfing patterns compare two bars instead of analyzing one, adding a second set of OHLC comparisons. Doji detection is simpler (body size below a threshold). Morning star and evening star patterns check three bars. None of these increase CPU or RAM consumption in any measurable way. The candle-close timing bottleneck, broker timezone effects, and disconnection recovery behavior apply equally to all of them.
How do I verify my pattern EA is detecting candles correctly after VPS deployment?
Attach the EA to a demo account on the VPS first. Let it run through at least two daily candle closes and several H4 closes. Compare the EA’s journal output (the Print() statements logging detected patterns) against the visual chart. If the EA logs a hammer on EURUSD H4 at 14:00 server time but the chart shows no hammer at that bar, the detection parameters or timeframe data access may be misconfigured. Running parallel instances on demo and live accounts during the first week catches configuration errors before they affect real capital.
References
- MetaQuotes. MQL5 Reference documentation. Covers CopyRates(), iTime(), SeriesInfoInteger(), TimeCurrent(), TimeTradeServer(), TimeLocal(), OnTick(), OnTimer(), EventSetTimer(), OrderSend(), OrderModify(), and RefreshRates(). The CCandlePattern::CheckPatternHammer() implementation in the Standard Library uses MathMin(Open(1),Close(1)) > (High(1)-(High(1)-Low(1))/3.0) for upper-third body position validation. Documentation on bar[0] states OHLC values “are consistent except for bar zero.” Used throughout this article for all MQL function behavior and candle data access mechanics. Source quality: primary platform documentation.
- MetaQuotes. MQL5 AlgoBook. Documents TimeTradeServer() interpolation behavior, noting it returns “the minutes and seconds of the client, not the server.” Used in this article for the VPS clock drift analysis and the recommendation to avoid TimeTradeServer() for candle-close logic. Source quality: official educational material from the platform developer.
- MetaQuotes. Virtual Hosting specifications (mql5.com/en/vps). Lists maximum 3 GB RAM, $10 to $15 per month pricing, DLL prohibition, and one trading account per subscription. Used for MetaQuotes VPS capability assessment. Source quality: primary vendor documentation.
- Fernando Carreiro, MQL5 Forum moderator. Statements on candle-close detection: “You can’t know when a candle closes. Only when a new tick arrives that starts a new bar is the old bar closed.” Separate statement on multi-asset EA threading: “Do not trade multiple currencies in one EA. A multi-asset EA runs in one thread so that one asset blocks all the others.” Used for the candle-close bottleneck analysis and the OnTick() vs OnTimer() architecture section. Source quality: experienced community developer with moderator status.
- Mark Falzon. Pinbar Signal EA, MQL5 Forum. Uses Tail_ratio=2.0 as default wick-to-body threshold for hammer detection. Used as a representative implementation of the standard community detection approach. Source quality: community developer, open code.
- EarnForex. Pinbar Detector indicator, MQL5 CodeBase. Over 36,000 views. Exposes nine configurable parameters including MaxNoseBodySize=0.33, NoseBodyPosition=0.4, and LeftEyeMinBodySize=0.1, implementing the three-bar pin bar model. Used for the distinction between single-bar hammer and three-bar pin bar detection architectures. Source quality: widely adopted community tool with open source code.
- MQL5 Forum, multiple threads. Documented cases include CopyHigh/CopyClose on daily bars returning data shifted by one full day between two VPS instances on the same broker. VPS clock drift of 1 to 3 seconds per 30 minutes correlating with MT5 connection failures. OrderSend() round-trip times of 40 to 200ms under normal conditions, 300 to 3,000ms during peak periods. Developer report of all CPU cores reaching 100% for up to 3 minutes when scanning 300+ CFDs via first-time CopyRates() calls. Developer running 60+ charts with 9 indicators averaging 15% CPU on a 4-core system. Used across multiple sections for community-measured performance data. Source quality: practitioner reports, not independently verified, but consistent across multiple users.
- ForexFactory Forum, multiple threads. Period-boundary congestion described as broker servers being “DOS-attacked by trading programs” causing requotes and failures. Deliberate 5-second execution delay documented as a countermeasure by experienced EA developers. DST transition confusion documented: “Right now the times are 1 hour off still as NY changed clocks before Europe.” Max bars reduction from 512,000 to 5,000 producing approximately 25 MB per terminal from user measurements. Used for practitioner observations on congestion, DST handling, and memory optimization. Source quality: community reports, anecdotal but consistent across threads.
- Red Hat. Documentation on virtual machine clock drift. Documented VM clock drift exceeding 120 seconds on VMware virtual machines under sustained CPU load. Used for the NTP configuration rationale. Source quality: enterprise Linux vendor documentation, applicable to VM environments generally.
- Steadfast Networks. Infrastructure documentation. Notes that “trading applications in particular will cause clock drift on Windows systems” under sustained CPU conditions. Used to support the NTP recommendation for trading VPS. Source quality: hosting provider, commercially motivated but technically specific.
- VPS provider operational data (commercially motivated). Benchmark data showing 1 to 3 active MT4 terminals averaging 10 to 30% CPU with news event spikes to 50 to 60%. RAM growth from approximately 30 MB to 500 MB over four weeks of continuous MT4 operation. These figures are directionally consistent with MQL5 forum community reports but originate from commercially interested sources selling VPS hosting. Used for resource consumption estimates with appropriate caveats. Source quality: vendor-published, flagged as commercially motivated.
Editorial Note
This article covers VPS infrastructure for running reversal pattern Expert Advisors. It is not financial advice. No claim is made that hammer or pin bar patterns produce profitable trading outcomes, and no specific trading strategy is recommended. The success rates cited for candlestick patterns (such as Thomas Bulkowski’s 60 to 67% figure referenced in the research phase) were not included in the article body because they describe trading outcomes, not infrastructure behavior.
Resource consumption figures (RAM per terminal, CPU percentages, max bars memory impact) are reference ranges drawn from MQL5 forum community reports and VPS provider benchmarks. Actual consumption varies by broker, instrument count, indicator load, and MetaTrader build version. The figures should be used for sizing guidance, not as guaranteed specifications.
VPS provider benchmark data cited in the resource requirements section originates from commercially interested sources. The figures are directionally consistent with independent community reports but should be treated as approximate.
Broker server time offsets (GMT+2/+3) represent the industry norm as of early 2026 but are set by individual brokers and can change. Confirm your broker’s current offset before configuring session-dependent EA logic.
OrderSend() execution times reported from MQL5 forum threads reflect individual user measurements on specific brokers and VPS configurations. They are not guaranteed to be representative of all broker and infrastructure combinations.