
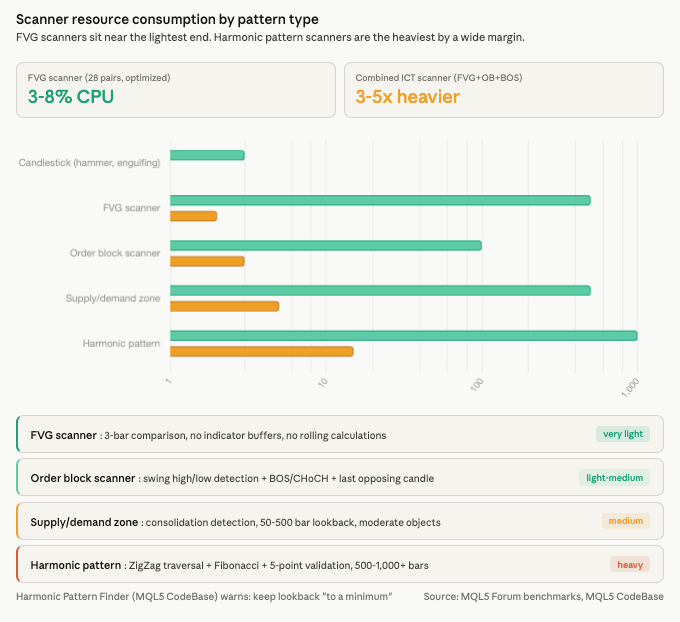
A fair value gap is three candles. If candle three’s low sits above candle one’s high, the gap between those two wicks is the FVG. The detection logic is a single comparison on completed bar data. A well-optimized 28-pair scanner running this check across four timeframes consumes 3 to 8 percent CPU on a modern VPS. Computationally, this is one of the lightest workloads you can run on MetaTrader.
The infrastructure problem is not computation. It is timing. The most significant FVGs form during London open (2:00 to 5:00 AM Eastern) and New York open (8:00 to 10:00 AM Eastern), when over 80 percent of daily forex volume concentrates. Western traders running scanners on home PCs miss the London open entirely. Edgeful data on YM Futures shows that over 60 percent of FVGs remain unfilled within the same session they form in, meaning the alert window for entry is narrow. An academic study analyzing 32,202 FVG events found that 30 to 45 percent of detected gaps fail to produce tradeable reactions, making continuous filtered monitoring the difference between catching high-probability setups and scanning through stale, already-mitigated zones the next morning.
This article covers the infrastructure side of running FVG scanner EAs on a VPS. It examines how MQL4/MQL5 code detects fair value gaps, which scanner architecture minimizes VPS resource consumption, how to configure alerts without drowning in noise, and why chart object accumulation is the real long-term performance threat that most scanner guides ignore. The focus is on keeping the scanner running reliably, not on whether FVGs work as a trading strategy.
Sources include MQL5 documentation, MQL5 Forum developer measurements, MQL5 Market product analysis (30+ FVG tools surveyed), academic research, Edgeful session data, and VPS provider benchmarks. Commercially motivated sources are flagged where cited.
How FVG Scanner EAs Detect Fair Value Gaps in MQL
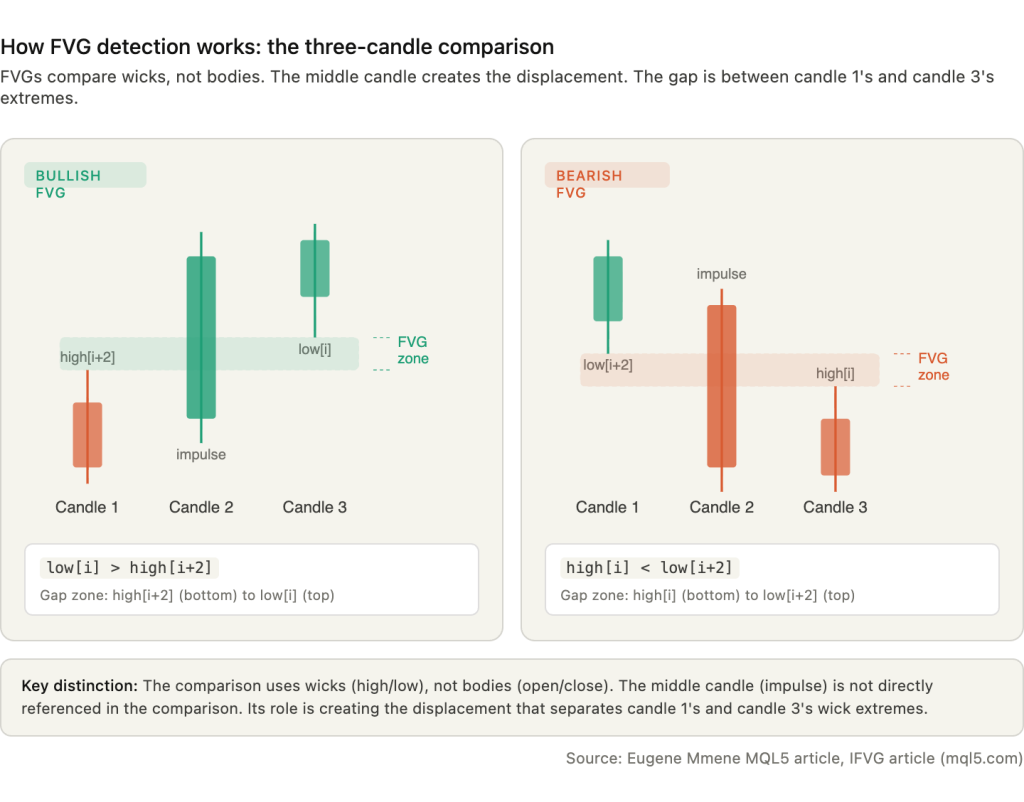
FVG detection compares candle wicks, not bodies. This is a common misconception in introductory FVG content, and getting it wrong in code produces a fundamentally different set of detected zones. The three-candle logic checks whether the extremes of candle one and candle three overlap. If they do not, the space between them is the fair value gap.
For a bullish FVG, the condition is: low[i] > high[i+2]. Candle three’s low sits above candle one’s high. The gap zone spans from high[i+2] (bottom boundary) to low[i] (top boundary). For a bearish FVG, the condition reverses: high[i] < low[i+2]. Candle three’s high sits below candle one’s low. The gap zone spans from high[i] (bottom) to low[i+2] (top). In both cases, the middle candle is the impulse candle that created the displacement, but it is not directly referenced in the comparison. Its role is structural, not computational.
Source code from Eugene Mmene’s MQL5 article (mql5.com/en/articles/18669) demonstrates the implementation. The DetectFVGs() function loops through bars, calculates the normalized gap in points using gap = (low0 – high2) / _Point, and triggers detection when the gap exceeds a configurable minPts threshold. The IFVG article (mql5.com/en/articles/20361) confirms identical logic, iterating from shift 3 down to 1 and fetching iLow(symbol, tf, i) and iHigh(symbol, tf, i+2) for each bar.
In MQL4, the standard functions are iHigh(), iLow(), iOpen(), iClose(), and iTime(), each accepting symbol, timeframe, and bar shift parameters. This enables cross-symbol and cross-timeframe queries from a single chart. In MQL5, the preferred approach uses CopyRates(), which copies MqlRates structures containing open, high, low, close, time, and volume fields into an array. However, MQL5 moderator Alain Verleyen notes on the MQL5 Forum (mql5.com/en/forum/490918) that CopyRates is the least efficient of the CopyXXX functions. Since FVG detection needs only highs and lows, using CopySeries or the specific CopyHigh()/CopyLow() functions is preferable. For a scanner iterating through 28 pairs and 4 timeframes on every check cycle, this efficiency difference compounds.
Every well-coded FVG scanner gates detection behind a new-bar check. The pattern compares iTime(_Symbol, PERIOD_CURRENT, 0) against a cached lastBarTime variable. If the values match, no new bar has formed and the scanner skips processing entirely. Without this gate, the scanner runs the full detection loop on every incoming tick, which on EURUSD during London session can mean hundreds of redundant executions per minute. With the gate, the scanner fires once per completed bar and consumes near-zero CPU between formations.
Multi-timeframe scanning works because MQL5’s CopyRates() and iHigh()/iLow() accept an independent timeframe parameter. A scanner attached to an M15 chart can query H4 bar data without requiring an H4 chart to be open. The terminal builds higher-timeframe bars from cached M1 data. One caveat documented across multiple MQL5 Forum threads: data for non-chart timeframes is not available in OnInit() after a cold start. The first CopyRates() call for a symbol or timeframe not yet cached returns -1 while data downloads asynchronously. Scanners must check return values and handle this gracefully, particularly after VPS reboots when all cached data is cleared.
FVG and imbalance are synonymous terms. Both describe the same three-candle non-overlapping wick pattern, and the detection code is identical. Order block scanners are substantially more complex, requiring swing high/low detection, market structure analysis (break of structure, change of character), and lookback periods of 10 to 100+ bars to identify the last opposing candle before a structural break. Combined ICT scanners that detect FVGs, order blocks, breaker blocks, and liquidity sweeps simultaneously carry resource implications that compound additively, with each concept generating its own set of chart objects and state tracking. For pure FVG scanning on a VPS, the standalone three-candle detector is the lightest option by a significant margin.
Configurable Parameters That Affect VPS Load
Every FVG scanner exposes a set of input parameters that control what gets detected, what gets displayed, and what triggers an alert. Most traders adjust these for trading purposes. From an infrastructure perspective, several of them directly determine how much CPU, RAM, and rendering overhead the scanner consumes on a VPS running 24/5.
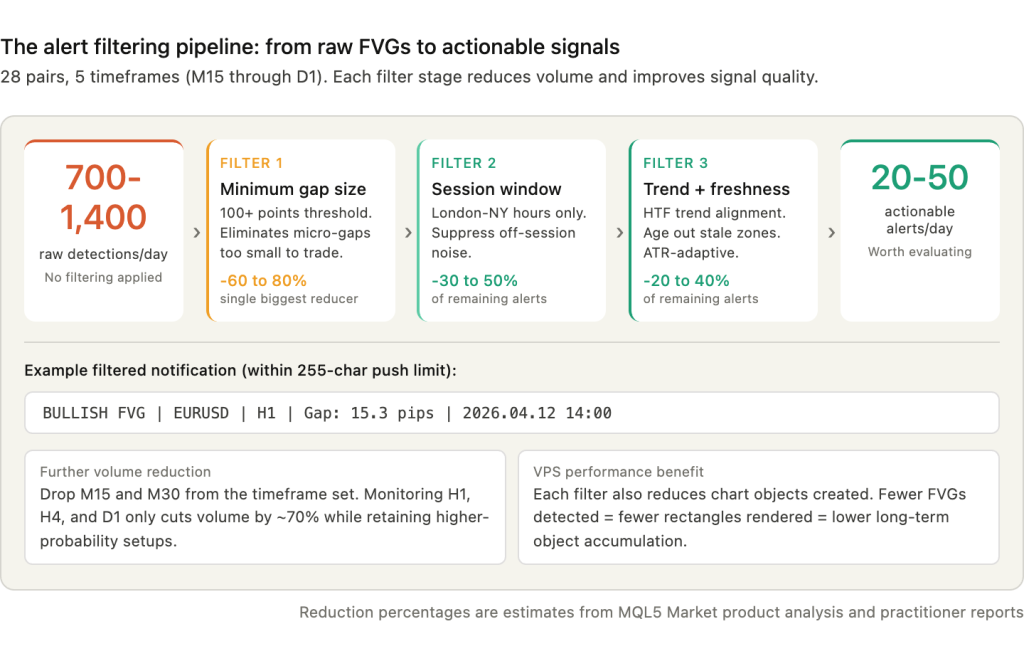
Minimum gap size is the single most effective parameter for both noise reduction and VPS load. The standard default across the 30+ MQL5 products surveyed is 100 points (10 pips on a 5-digit broker), configured as input int minPts = 100. Raising this threshold eliminates micro-gaps that are too small to trade but still generate chart objects and alerts. On M15 charts, a 28-pair scanner without a minimum gap filter can detect 5 to 15 FVGs per pair per day. With a 100-point minimum, that drops to 2 to 5 per pair. The difference in alert volume is the difference between 700 to 1,400 notifications per day and a manageable 30 to 60.
Lookback period controls how many historical bars the scanner checks on each cycle. The typical default is 500 bars, configured as input int InpHistoryBars = 500. For a scanner running on H1 charts, 500 bars spans roughly 21 trading days. The raw data cost is small: each MqlRates struct is 60 bytes, so 28 pairs across 4 timeframes at 500 bars each totals 3.36 MB. The real cost is in object creation. Every historical FVG within the lookback window gets drawn as a rectangle on the chart. Reducing lookback to 200 bars cuts both computation and visual clutter without sacrificing detection of current setups, since most FVG trading strategies focus on gaps formed within the last 1 to 5 days.
Maximum objects caps the number of rectangles displayed per chart. Without a cap, a 28-pair scanner accumulates 10 to 50 new objects per pair per day. Over weeks of continuous operation, this reaches tens of thousands of chart objects, which is the primary cause of terminal slowdown on long-running VPS deployments. Setting a maximum of 50 to 100 objects per chart and pruning older or already-mitigated FVGs keeps rendering overhead stable. Section 8 covers object accumulation in detail.
Gap fill percentage defines when an FVG is considered mitigated. The standard threshold is 50 percent, reflecting the ICT concept of “consequent encroachment” where price retracing to the midpoint of the gap is treated as a fill. Some scanners use full-range fill (price must completely traverse the zone). The infrastructure impact is indirect: scanners that track fill state maintain additional data per FVG (Active, Tapped, Filled, Inverted) and update these states on every bar, adding a small but cumulative processing cost. The Imbalance Finder indicator by Aurora_Technologies exposes 7 data buffers tracking these states, enabling separate trading EAs to read FVG status via iCustom() without duplicating the detection logic.
Advanced filtering parameters found in commercial scanners include ATR-based adaptive thresholds (LuxAlgo’s Pine Script implementation adjusts sensitivity dynamically to current volatility), EMA and ADX regime detection filters that suppress FVG alerts during ranging markets, session time windows that restrict detection to London or New York hours, trend direction filters that only flag FVGs aligned with higher-timeframe direction, and freshness filters that age out stale gaps. Each filter adds a small computational cost per bar but substantially reduces both alert volume and chart object count, making them net positive for VPS performance.
Why 24/7 VPS Operation Matters for FVG Scanning
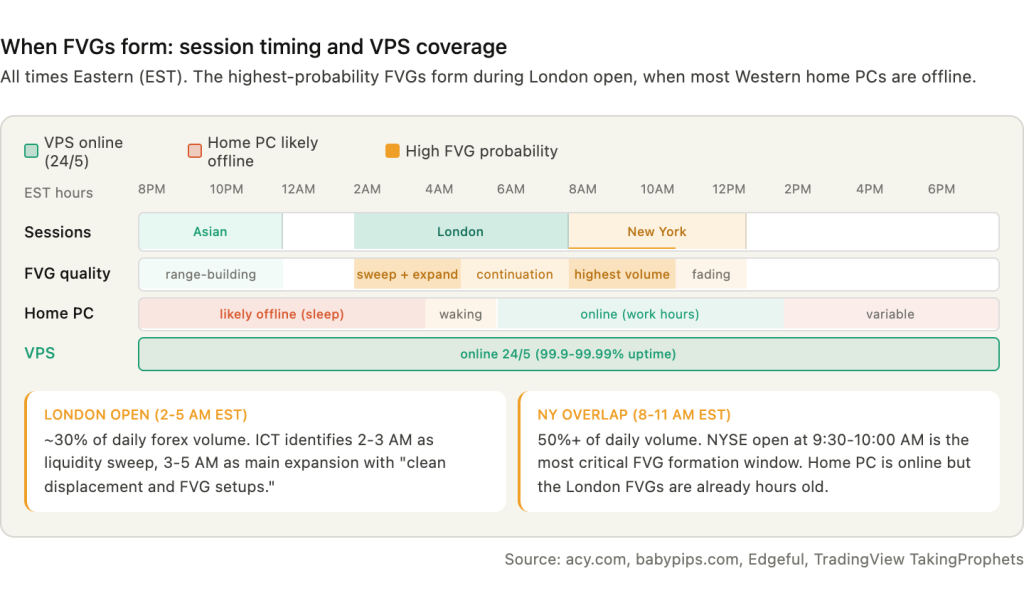
FVG formation is not evenly distributed across the trading day. The gaps that produce the strongest price reactions concentrate in two windows that most Western traders’ home setups miss entirely.
London session open (2:00 to 5:00 AM Eastern) generates the most significant FVGs in forex. London accounts for roughly 30 percent of daily forex trading volume, and the session open is where institutional flow enters after the Asian consolidation range has been established. The ICT methodology identifies 2:00 to 3:00 AM London Time as the “liquidity sweep and trap move,” often where the daily high or low forms, followed by 3:00 to 5:00 AM as the main expansion phase that produces “clean displacement and FVG setups for entries.” A trader in New York or Chicago whose scanner runs on a home PC that went to sleep at midnight has no awareness that these gaps formed until hours later.
New York session open (8:00 to 10:00 AM Eastern) is described in ICT literature as more volatile than London, with higher liquidity concentration. The NYSE open at 9:30 to 10:00 AM is considered one of the most critical windows for FVG formation. The London-New York overlap from 8:00 to 11:00 AM concentrates over 50 percent of daily trading volume, producing the highest probability of large displacement candles that create wide, tradeable gaps.
Asian session FVGs (approximately 8:00 PM to midnight Eastern) serve a different function. The ICT principle describes it concisely: “Asia builds the trap. London triggers the trap. New York exploits the boundary to deliver the true move.” The Asian session establishes a consolidation range whose high and low become the levels that London’s institutional flow sweeps. A scanner that misses Asian session formation cannot identify the range boundaries that define the next day’s setup.
The fill rate data reinforces why real-time detection matters. Edgeful’s analysis of YM Futures on 30-minute charts over six months found that 60.71 percent of bullish FVGs and 63.2 percent of bearish FVGs remain unfilled within the same session they form in. By wick measurement, approximately 50 percent go entirely untouched. This contradicts the popular assumption that “all gaps must fill.” Practitioners estimate 70 to 80 percent eventually fill over longer timeframes, but the entry window is narrow. As DailyPriceAction notes: “A FVG is a one-time use area. Once price trades back into it and fills the imbalance, the edge is gone.”
If the scanner is offline when the FVG forms and price retraces to fill it before the trader checks in, the opportunity is permanently lost.
The counterargument is that scanners can detect historical FVGs retroactively by analyzing past bars after a restart. This is technically correct. The three-candle pattern is visible in historical data. But four problems undermine the lookback approach. Fresh FVGs tend to produce more reliable reactions than older ones. The entry timing window may have already closed. The FVG may have been mitigated during the scanner’s downtime. And the real-time alert that enables immediate analysis and preparation is permanently lost. A scanner that was running when the gap formed gives the trader minutes to evaluate. A scanner that detects the gap three hours later gives the trader a stale zone that may already be half-filled.
Home PC uptime runs 95 to 98 percent under favorable conditions, translating to 175 to 438 hours of downtime per year. A 99.99 percent VPS SLA translates to less than 53 minutes per year. The difference is not about raw speed or CPU power. It is about whether the scanner is running during the two to three hours each day when the highest-probability FVGs form.
OnTimer() vs OnTick(): Why Timer-Based Scanning Wins for FVG
OnTick() is the wrong event handler for multi-symbol FVG scanning. It fires on every incoming tick, but only for the chart’s own symbol. A scanner attached to a EURUSD chart receives no OnTick() events from GBPUSD, AUDJPY, or any of the other 27 pairs it monitors. For single-symbol EAs that trade on their own chart, OnTick() with new-bar gating works well. For a multi-pair scanner, it creates two problems: it misses new bars on non-chart symbols entirely, and it fires hundreds of times per minute on volatile instruments when FVG detection only needs completed bars.
OnTimer() fires at a user-defined interval set by EventSetTimer(seconds) in OnInit(), independent of tick arrival and independent of which symbol generates activity. MQL5 developer Anthony Garot recommends on the MQL5 Forum (mql5.com/en/forum/321480): “Most scanners I write scan every 5 seconds because I don’t need instant updates across dozens of symbols.” A separate MQL5 Forum thread (mql5.com/en/forum/437672) confirms the approach: “Run your scanner from OnTimer() instead of OnTick().”
The optimal architecture for VPS-based FVG scanning calls EventSetTimer(5) in OnInit(), then iterates through arrays of symbols and timeframes in OnTimer(), checking IsNewBar() for each symbol/timeframe combination before running the three-candle detection. When no new bars have formed on any monitored pair or timeframe, the entire OnTimer() cycle completes in microseconds. The scanner consumes measurable CPU only at bar boundaries, and even then only for the specific pairs where a new bar has appeared.
The single-chart multi-symbol scanner is the recommended architecture for VPS deployments. One EA attached to one chart loops through all 28 pairs using CopyRates(symbolName, timeframe, …) or CopyHigh()/CopyLow() with the target symbol as a parameter. This requires calling SymbolSelect(symbolName, true) for each monitored pair to ensure data availability. The result is one chart window, one EA process, and a predictable memory footprint.
The alternative, running one EA per chart across 28 pairs, provides true parallelism because each EA runs in its own thread on MT5. Each EA receives OnTick() natively for its symbol, eliminating the need for OnTimer() polling. But 28 chart windows at 30 to 50 MB each on MT4 (40 to 70 MB on MT5) adds 840 MB to nearly 2 GB of additional RAM compared to the single-chart approach. On a 4 GB VPS where Windows Server already claims 1 GB, this difference determines whether the setup runs comfortably or pushes into swap.
One MT4-specific limitation makes the single-chart approach particularly important on that platform. MT4 has one shared trade context. Only one EA or script can execute a trade at any time. If two EAs attempt OrderSend() simultaneously, one receives Error 146: “Trade Context Busy.” MT5 provides 8 trade contexts, making simultaneous execution from multiple EAs far more reliable. For FVG scanners that both detect and trade, MT5 is strongly preferred. For scanners that only detect and alert, the trade context limitation does not apply, and either platform handles the single-chart architecture without issues.
Alert Configuration: Push, Email, Telegram, and Filtering
A 28-pair FVG scanner monitoring five timeframes (M15, M30, H1, H4, D1) without filtering can generate 700 to 1,400 alerts per day. M15 charts alone produce 5 to 15 FVGs per pair daily. At that volume, alerts stop being useful and become noise. The configuration challenge is not getting alerts to work. It is keeping them selective enough that each notification represents a setup worth evaluating.
MetaTrader supports four alert channels, each with distinct VPS implications.
Push notifications via SendNotification() deliver text directly to the MT4/MT5 mobile app. The current MQL5 documentation specifies a 255-character maximum per message. Rate limiting is strict: no more than 2 calls per second and no more than 10 per minute. Exceeding these limits can disable the function entirely for the session. Setup requires the MetaQuotes ID from the mobile app’s Settings, Messages section, entered in the desktop terminal under Tools, Options, Notifications. The desktop terminal must be running for notifications to send, which is a direct VPS dependency. If MetaTrader crashes on the VPS, push notifications stop along with everything else.
Email alerts via SendMail() require SMTP configuration under Tools, Options, Email. Gmail works with smtp.gmail.com on port 465 using SSL, but requires an App Password rather than the account password. Gmail may also block login attempts from unfamiliar VPS IP addresses. For VPS deployments, dedicated SMTP relay services like SMTP2GO (mail.smtp2go.com on port 2525) are more reliable because they do not flag data center IPs as suspicious. The terminal requires a restart after initial SMTP configuration.
Telegram integration is not built into MetaTrader. EAs send Telegram alerts via the WebRequest() function calling the Telegram Bot API. Setup requires creating a bot through @BotFather, obtaining the chat ID via the getUpdates endpoint, and adding https://api.telegram.org to MetaTrader’s allowed WebRequest URLs under Tools, Options, Expert Advisors. The Telegram API allows approximately 30 messages per minute per bot. Two VPS-specific issues affect Telegram alerts: some VPS providers or network configurations block the Telegram API domain, and port 443 must be open. Error 4006 (HTTP response 0) is the common symptom of a firewall or SSL issue blocking the connection. Most commercial FVG scanners on MQL5 Market do not include built-in Telegram integration. Traders typically run a separate Telegram relay EA or library alongside their scanner.
Sound alerts via PlaySound() are functionally useless on a VPS because nobody is physically present to hear them. Disable sound alerts to eliminate the minor overhead of loading and playing .wav files on every detection.
Filtering is where alert configuration becomes an infrastructure decision. The most effective filters in order of impact on alert volume: minimum gap size in pips (the single most effective reducer, cutting raw detection counts by 60 to 80 percent), session time windows restricting alerts to London-New York overlap or specific ICT killzones, trend direction filters that suppress FVGs against the higher-timeframe trend, ATR-adaptive filtering that adjusts the minimum gap threshold dynamically based on current volatility, and lookback limits that cap the historical scan depth (FVG Screener PRO defaults to 200 candles).
A well-formatted push notification for an FVG alert should include the direction, symbol, timeframe, gap size, and formation time within the 255-character limit. A practical format looks like: BULLISH FVG | EURUSD | H1 | Gap: 15.3 pips | 2026.04.12 14:00. This gives the trader enough context to decide whether to open the mobile app or RDP into the VPS for closer analysis.
With proper filtering, a 28-pair scanner that would otherwise generate over a thousand daily alerts can be reduced to 20 to 50 actionable notifications, each representing a gap that meets minimum size, session, and trend criteria. That is the difference between an alert system that gets muted on day two and one that remains useful for months.
Resource Requirements: Lighter Than You Expect
FVG detection is a three-bar comparison. There are no Fibonacci calculations, no ZigZag traversals, no regression analysis, no rolling indicator buffers to maintain. The computational cost of checking whether low[i] > high[i+2] across 28 pairs is negligible. The resource story for FVG scanners is not about CPU. It is about data caching, chart object rendering, and how the terminal manages memory for multi-symbol, multi-timeframe access.
CPU consumption for a well-optimized 28-pair, 4-timeframe FVG scanner using OnTimer(5) with new-bar gating runs 3 to 8 percent under normal market conditions. During high-volatility events when tick volume surges 5 to 10 times above baseline, MT4 and MT5 both spike to 50 to 60 percent CPU regardless of what EAs are running, because the terminal itself consumes cycles processing the incoming tick stream. Poorly coded scanners that skip new-bar gating or call CopyRates() on every tick can reach 12 to 15 percent CPU per currency pair, which on 28 pairs would saturate any VPS. The difference between 3 percent total and 400 percent total is entirely in the code quality, not in the hardware.
For context, one MQL5 developer ran 11 live MT4 accounts on an 800 MHz Pentium III laptop for nearly two years at under 10 percent CPU. Another ran 60+ charts with 9 indicators each averaging 15 percent on a 4-core system. FVG scanners with proper gating sit well below either of these benchmarks.
RAM consumption is dominated by the terminal’s internal timeseries caching rather than the scanner’s own data. The raw rate data for a 28-pair, 4-timeframe scanner at 500 bars lookback totals 3.36 MB (each MqlRates struct is 60 bytes: 28 x 4 x 500 x 60 = 3,360,000 bytes). That is trivial. The overhead comes from the terminal caching price history for each symbol/timeframe combination, adding 5 to 20 MB per combination. An MQL5 article on memory consumption documents that a compound indicator using 5 timeframes consumes 3 times or more memory than single-timeframe equivalents because each requested timeframe creates its own cached timeseries per symbol.
The max bars setting has the largest single impact on RAM. With the default 512,000 bars, a single MT4 terminal can exceed 1 GB. Reducing to 5,000 bars, which is far more than the 200 to 500 bar lookback any FVG scanner actually uses, drops memory to approximately 25 MB per terminal in documented ForexFactory tests. This optimization takes ten seconds and should be the first thing configured on any VPS running a scanner.
Practical RAM budget for a typical FVG scanning setup: Windows Server OS claims roughly 1 GB. An MT5 terminal with community features disabled uses approximately 350 MB baseline. A 28-pair scanner with charts at optimized max bars settings adds approximately 1.1 GB (28 charts at roughly 40 MB each). Total: 2.5 to 3.5 GB for the scanner alone. If trading EAs run alongside the scanner on the same terminal or on a separate instance, add 1 to 2 GB of headroom.
Compared to other pattern scanner types, FVG scanning sits at the lighter end. Candlestick pattern scanners (hammers, engulfings) are slightly lighter because they check 1 to 2 bars with no chart objects. Order block scanners are light to medium, requiring swing detection and 10 to 100 bar lookbacks. Supply and demand zone scanners add consolidation detection logic across 50 to 500 bars. Harmonic pattern scanners are the heaviest, requiring ZigZag traversal, Fibonacci validation, and 5-point pattern matching across 500 to 1,000+ bars. The Harmonic Pattern Finder on MQL5 CodeBase explicitly warns users to keep lookback bars “to a minimum to avoid over consumption of client resources.” Combined ICT scanners that detect FVGs alongside order blocks, breaker blocks, and liquidity sweeps run approximately 3 to 5 times the footprint of a standalone FVG scanner but remain far lighter than harmonic detectors.
Chart Object Accumulation: The Real VPS Performance Threat
CPU and RAM get the attention when traders size a VPS for scanning workloads. Chart object accumulation is the problem that actually causes terminals to freeze after weeks of continuous operation, and most FVG scanner guides never mention it.
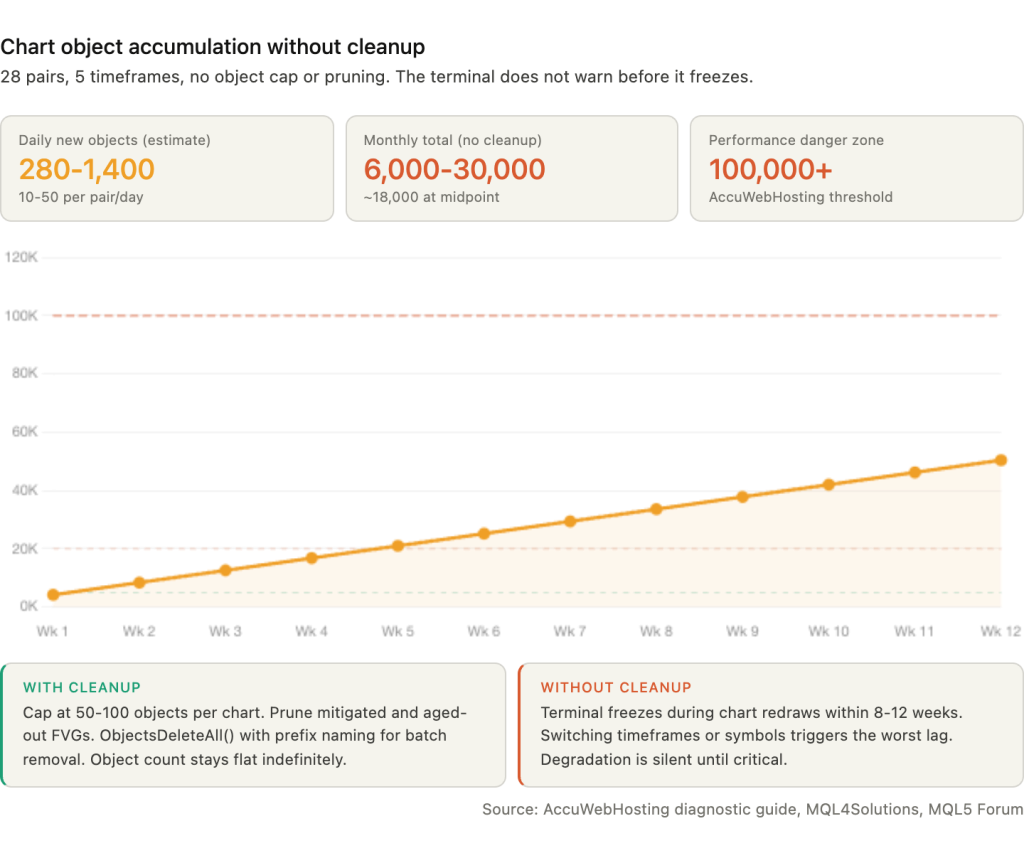
FVG scanners draw a rectangle for every detected gap using ObjectCreate() with OBJ_RECTANGLE. Each rectangle persists on the chart until explicitly deleted. On a 28-pair setup monitoring 5 timeframes, each pair accumulates roughly 10 to 50 new objects per day depending on timeframe mix and minimum gap settings. At the conservative end, that is 280 new objects daily. At the upper end, 1,400. Over a month of continuous 24/5 operation without cleanup, a scanner accumulates 6,000 to 30,000 chart objects. AccuWebHosting’s MetaTrader diagnostic guide flags object counts above 100,000 as a major cause of terminal performance degradation. MQL4Solutions warns directly: “Creating graphical objects in MT4 or MT5 is generally a slow operation… indicators or EAs that generate objects are usually obvious. They draw boxes, regions, text, lines and labels.”
The performance impact is not linear. A terminal with 500 objects renders normally. At 5,000, chart scrolling becomes noticeably sluggish. At 20,000 or more, the terminal can freeze during chart redraws, particularly when switching timeframes or symbols. Each chart redraw iterates through every object to determine visibility and rendering parameters. On a VPS where the terminal runs unattended for weeks, this degradation happens silently until the terminal becomes unresponsive during a critical trading period.
Four cleanup strategies address this problem at different levels.
Prefix-based batch deletion uses ObjectsDeleteAll(0, “FVG_”) to remove all objects whose names start with a common prefix. This requires the scanner to name objects consistently (e.g., “FVG_EURUSD_H1_20260412_1400”) and allows scheduled cleanup of old zones without affecting other chart annotations.
Pruning by age or status deletes FVGs that are older than a configurable number of bars or that have already been mitigated. Since most FVG trading strategies focus on gaps formed within the last 1 to 5 days, removing zones older than 500 bars costs nothing in terms of usable signals.
Configurable maximum object count, available in many commercial scanners, caps the number of visible rectangles per chart. When the limit is reached, the oldest objects are deleted as new ones are created. A cap of 50 to 100 objects per chart keeps rendering overhead stable regardless of how long the scanner has been running.
Canvas-based rendering via the CCanvas class eliminates per-object overhead entirely by drawing FVG zones directly onto a bitmap overlay rather than creating individual chart objects. This is the most technically demanding approach and is not common in marketplace products, but it is the most scalable solution for scanners monitoring dozens of pairs across multiple timeframes.
Beyond object accumulation, MetaTrader terminals exhibit gradual memory growth from cached timeseries data even without EA-related issues. Internal snapshots are cached for up to 30 minutes before release. One MQL5 Forum user reported that an EA running for 2 to 3 weeks caused CPU to reach 100 percent and memory to climb to approximately 30,000K, resolved only by restarting MetaTrader. Weekly restarts during the Saturday/Sunday market close via Windows Task Scheduler are standard practice for any long-running scanner deployment. If Task Manager shows RAM utilization above 80 percent of available memory before the scheduled restart, move the restart earlier.
Practical VPS Deployment Checklist
The difference between a scanner that runs reliably for months and one that freezes within weeks is usually configuration, not hardware. Most of the settings that matter take minutes to adjust but are easy to overlook during initial deployment.
Set “Max bars in chart” to 5,000 or 10,000 under Tools, Options, Charts. This is the single highest-impact optimization for any scanner deployment. Most FVG scanners look back 200 to 500 candles. Loading 512,000 bars of history per chart consumes over 1 GB of RAM that the scanner never accesses. Documented ForexFactory tests show that reducing from 500,000 to 5,000 bars across 23 pairs drops terminal memory from over 1 GB to approximately 25 MB.
Clean the Market Watch window. Press Ctrl+M, right-click, select “Hide All” to remove every symbol, then re-add only the 28 pairs the scanner monitors. Each unused symbol in Market Watch consumes memory for price caching and network bandwidth for tick data that serves no purpose.
Build a reusable template. Configure one chart with the FVG scanner EA attached, all input parameters set, and the visual layout finalized. Right-click the chart, select Templates, Save Template (e.g., “FVG_Scanner_H1.tpl”). Apply this template to each new symbol’s chart rather than reconfiguring from scratch. Save the complete chart layout as a Profile under File, Profiles, Save As. Profiles restore the full multi-chart configuration after terminal restarts, which matters for a 28-pair setup where manually reopening and configuring charts would take 30 minutes or more.
Use portable mode for multi-terminal setups by appending /portable to the MT5 shortcut target path. All data, including EAs, indicators, templates, logs, and settings, stores within the installation folder rather than scattered across the Windows user profile. This simplifies backup and VPS migration. Do not install MetaTrader in the Program Files directory due to Windows permission restrictions. MetaTrader supports up to 32 terminals per Windows user session, though practical stability limits are 24 to 28 instances.
Automate log cleanup. FVG scanners using Print() to log every detected gap generate large log files during continuous 24/5 operation. Logs accumulate in the terminal data directory under MQL5\Logs. Set up a Windows Task Scheduler job to compress or archive log files older than 30 days. If the scanner exposes a verbosity setting, reduce it to errors and trade-relevant events only.
After deployment, verify five things before leaving the scanner unattended. Check the Experts tab for initialization messages and errors. Confirm that FVG rectangles appear on at least one chart where gaps are expected. Send a test push notification to verify the alert pipeline from VPS to phone. Confirm all 28 symbols show live prices in Market Watch with no “Waiting for update” status. Open Task Manager and verify CPU sits below 80 percent with at least 20 percent free RAM. MT5’s built-in Task Manager (F2 key) provides per-EA CPU and memory breakdowns that Windows Task Manager cannot.
The FVG Scanner Ecosystem on MQL5
The MQL5 Market and CodeBase now host over 30 FVG-related products ranging from free single-timeframe indicators to comprehensive commercial dashboards combining FVGs with order blocks, break of structure, and liquidity sweep detection. Understanding what is available helps avoid both overpaying for features a scanner does not need and under-specifying for a VPS deployment that requires multi-pair, multi-timeframe coverage.
The community benchmark for free FVG detection is Cao Minh Quang’s “Fair Value Gaps” indicator for MT5, rated 4.88 out of 5 from 88 reviews with 107 comments. Version 3.5, updated December 2025, supports multi-timeframe detection, automatic FVG identification, combined BOS/CHoCH and order block visualization, and both standard FVGs and Inverted FVGs (IFVGs). An MT4 version exists at a lower rating of 3.88 from 11 reviews. For traders setting up their first FVG scanner on a VPS, this indicator provides a reliable starting point with active community support and regular updates.
The most reviewed free FVG EA (detection plus auto-trading) is Allan Munene Mutiiria’s “Fair Value Gap SMC EA,” rated 4.71 out of 5 from 25 reviews with 76 comments. Version 13.0, updated February 2026, scans for un-mitigated FVGs, draws visual zones, and opens positions when price reverts to the gap. For VPS deployments where the scanner both detects and trades, this EA demonstrates the typical architecture: detection logic running on completed bars, visual rectangles for chart display, and OrderSend() execution when price enters an active zone.
For developers building custom trading systems on top of FVG detection, the Imbalance Finder by Aurora_Technologies on MQL5 CodeBase stands out. It exposes 7 data buffers accessible via iCustom(), distinguishing between Active, Tapped, Filled, and Inverted FVG states. A separate trading EA can read these buffers without duplicating the detection logic, which is the cleanest architectural separation for VPS deployments where the scanner and the execution logic should be independently manageable.
Commercial products range from $40 to $149. WH Fair Value Gap EA MT5 ($40, rated 5.0 from 6 reviews) supports multi-symbol scanning across EURUSD, GBPUSD, USDJPY, and XAUUSD on H1 timeframes. KT Fair Value Gap MT5 ($45) adds a dashboard showing the percentage of mitigated versus unmitigated gaps. At the premium end, Smart SMC Pro (launch offer $49, regular $149) provides a complete SMC toolkit combining order blocks, FVGs, BOS, CHoCH, and liquidity sweeps in a single EA.
Dashboard products that combine multiple ICT concepts into a single interface represent the heaviest scanner category. The Market Structure Order Block Dashboard MT5 integrates swing structure (HH/HL/LH/LL), BOS, CHoCH, order blocks, FVGs, liquidity zones, sessions, and volume profile. The SMC Multi TF Explorer provides automatic order block and FVG detection across multiple timeframes with interactive UI for toggling visibility. These products carry the highest VPS resource footprint in the category, roughly 3 to 5 times a standalone FVG scanner, because each detected concept generates its own set of chart objects and state tracking data.
One pattern is consistent across the entire ecosystem: no product in the marketplace discusses VPS optimization, execution latency, or chart object management in its description. The focus is entirely on detection logic, visual features, and trading parameters. The infrastructure layer that determines whether these tools run reliably for months on a VPS is treated as invisible. That gap is what the preceding sections of this article address.
FAQ
How many alerts will a 28-pair FVG scanner generate per day?
Without filtering, 700 to 1,400 on a setup monitoring M15 through D1. M15 charts alone produce 5 to 15 FVGs per pair daily, and most of those are micro-gaps too small to trade. With proper filtering (minimum gap size of 100+ points, session time windows restricted to London-NY hours, trend direction alignment), the volume drops to 20 to 50 actionable alerts per day. The minimum gap size parameter is the single most effective reducer, eliminating 60 to 80 percent of raw detections. If alerts are still overwhelming after configuring these filters, narrow the timeframe set. Dropping M15 and M30 and monitoring only H1, H4, and D1 cuts volume by roughly 70 percent while retaining the higher-probability setups.
Can I run an FVG scanner on MetaQuotes’ built-in VPS?
Yes, if the scanner is pure MQL5 code with no external dependencies. MetaQuotes VPS runs standard MQL5 EAs and indicators, provides sub-3ms latency to most broker servers, and costs $12.80 to $15 per month. The limitations that affect FVG scanning specifically: DLL calls are completely prohibited, so any scanner using external libraries will fail with a critical error on deployment. WebRequest permissions are not transferred from the desktop terminal, which means Telegram integration via the Bot API will not function. The maximum is 32 charts on the paid tier (16 on free), which covers a 28-pair setup but leaves little room for additional terminals. There is no Windows desktop access for troubleshooting, no way to check Task Manager, and no ability to review logs through the file system. For a simple MQL5 scanner sending only push notifications, MetaQuotes VPS works. For anything involving Telegram alerts, DLL-based components, or manual VPS monitoring, a dedicated Windows VPS is necessary.
Do FVG scanners repaint?
Well-coded ones do not. Non-repainting scanners process only completed bars, never bar[0]. The SMC FVG Auto-Detector on MQL5 CodeBase states explicitly: it “relies strictly on closed candles, ensuring that once an FVG is drawn, it never repaints or shifts.” The new-bar gating pattern (checking iTime against a cached value before running detection) inherently prevents repainting because the scanner only evaluates bars whose OHLC values are final. Scanners that analyze bar[0] in real time will show FVGs appearing and disappearing as the current candle forms, which is repainting by definition. Check product descriptions for “non-repainting” confirmation before deploying on a VPS where visual consistency matters for post-session review.
What is the difference between an FVG indicator and an FVG EA?
An indicator detects and draws. It identifies FVG zones, renders rectangles on charts, and can send alerts, but it cannot place or manage trades. An EA detects and can trade. It runs the same three-candle logic but also calls OrderSend() to open positions when price enters an active zone. On a VPS, the distinction affects resource consumption: a trading EA maintains open position tracking, order management logic, and error handling routines that an indicator does not. The distinction also affects MetaQuotes VPS compatibility. Both indicators and EAs run on MetaQuotes VPS, but trading EAs on that platform are limited to one account per subscription and cannot use DLL-based risk management libraries.
How often should I restart MetaTrader on the VPS?
Weekly, during the Saturday/Sunday market close. MetaTrader terminals exhibit gradual memory growth from cached timeseries data and accumulated chart objects even without code bugs. One MQL5 Forum user documented CPU reaching 100 percent and memory climbing to approximately 30,000K after 2 to 3 weeks of continuous operation, resolved only by restarting the terminal. A weekly Task Scheduler job that kills and relaunches the terminal process on Saturday clears cached data, resets object counts, and restores baseline memory. If Task Manager shows RAM above 80 percent of available memory before the scheduled restart window, do not wait. Restart immediately to prevent the terminal from entering swap, which degrades tick processing and can cause missed detections during the next session open.
References
- Eugene Mmene. “Fair Value Gap (FVG) Detector” MQL5 article (mql5.com/en/articles/18669). Source code demonstrating the DetectFVGs() function: loops through bars, calculates normalized gap in points via gap = (low0 – high2) / _Point, triggers detection above configurable minPts threshold. Used in this article for the canonical three-candle detection implementation. Source quality: published MQL5 article with working code.
- MQL5 article on Inverted FVG (IFVG) detection (mql5.com/en/articles/20361). Confirms identical detection logic to standard FVG, iterating from shift 3 to 1 using iLow(symbol, tf, i) and iHigh(symbol, tf, i+2). Used to corroborate the core detection pattern. Source quality: published MQL5 article.
- Alain Verleyen, MQL5 Forum moderator (mql5.com/en/forum/490918). Notes that CopyRates is the least efficient CopyXXX function and recommends CopySeries or specific CopyHigh()/CopyLow() for scenarios where only highs and lows are needed. Used for the data retrieval optimization recommendation. Source quality: experienced moderator with extensive MQL5 contribution history.
- Anthony Garot, MQL5 Forum developer (mql5.com/en/forum/321480). Recommends OnTimer(5) architecture for multi-symbol scanners: “Most scanners I write scan every 5 seconds because I don’t need instant updates across dozens of symbols.” Separate forum confirmation (mql5.com/en/forum/437672): “Run your scanner from OnTimer() instead of OnTick().” Used for the OnTimer() vs OnTick() architecture recommendation. Source quality: practitioner with documented scanner development experience.
- MQL5 Forum, multiple threads. Data not available in OnInit() for non-chart timeframes confirmed (mql5.com/en/forum/211353). First-time CopyRates() calls for non-current symbols return -1 while data downloads asynchronously. New bars do not appear simultaneously across symbols; each forms only after the first tick past the period boundary (mql5.com/en/forum/471075). Poorly coded scanners at 12-15% CPU per pair (mql5.com/en/forum/76835). Well-tuned multi-TF indicators at 1-2% CPU (mql5.com/en/forum/185044). EA running 2-3 weeks reaching 100% CPU and ~30,000K memory (mql5.com/en/forum/117968). MT4 single trade context limitation and MT5’s 8 trade contexts (mql5.com/en/forum/464313). 11 MT4 accounts on 800 MHz Pentium III at under 10% CPU. 60+ charts with 9 indicators averaging 15% on a 4-core system. Used across multiple sections for CPU benchmarks, architecture decisions, and long-running stability evidence. Source quality: practitioner reports, not independently verified, but consistent across multiple users and years.
- MQL5 article “Decreasing Memory Consumption by Auxiliary Indicators” (mql5.com/en/articles/259). Documents that compound indicators using 5 timeframes consume 3x or more memory than single-timeframe equivalents due to per-symbol timeseries caching. Used for the multi-timeframe RAM scaling analysis. Source quality: published MQL5 technical article.
- Aryan Kondapally (February 2026). “Fair Value Gap analysis.” World Journal of Applied Mathematics and Statistics. Analyzed 32,202 FVG events across 4 asset classes. Key finding: 30-45% of detected FVGs fail to produce predictable reactions. FVGs with low “degree” values (less than or equal to 0.00015 price units/second) generate 3.2x stronger reactions than steeper FVGs (p < 0.001) and achieve over 75% win rate in backtests. Full Python implementation on GitHub. Used for false positive rate and detection accuracy context. Source quality: published in a smaller/newer journal with some editorial irregularities. Treat with moderate confidence. The statistical methodology and reproducible code strengthen the findings.
- Edgeful. Analysis of YM Futures FVG fill rates on 30-minute charts over 6 months. Findings: 60.71% of bullish FVGs and 63.2% of bearish FVGs remain unfilled within the same session. By wick measurement, approximately 50% untouched. Used for the VPS timing argument and fill rate evidence. Source quality: trading analytics platform. Methodology not fully disclosed. Figures are directionally consistent with practitioner estimates.
- MQL5 Market and CodeBase product analysis. 30+ FVG products surveyed including: Fair Value Gaps by Cao Minh Quang (MT5, 4.88/5, 88 reviews, free), Fair Value Gap SMC EA by Allan Munene Mutiiria (4.71/5, 25 reviews, free), Imbalance Finder by Aurora_Technologies (7 data buffers, free), WH Fair Value Gap EA ($40), KT Fair Value Gap ($45), Smart SMC Pro ($49-$149), Market Structure Order Block Dashboard MT5, SMC Multi TF Explorer. Harmonic Pattern Finder (mql5.com/en/code/16435) warns about CPU consumption. SMC FVG Auto-Detector (mql5.com/en/code/70854) confirms non-repainting via closed-candle processing. Used for ecosystem analysis, product recommendations, and resource comparison benchmarks. Source quality: primary marketplace listings with user ratings and version history.
- ICT methodology session timing sources. acy.com: London 2-3 AM as liquidity sweep, 3-5 AM as main expansion, Asian session builds the range London sweeps. writofinance.com: New York “more volatile and contains huge liquidity.” babypips.com: London-NY overlap concentrates 50%+ of daily volume. TradingView TakingProphets indicator: NYSE open 9:30-10:00 AM critical for FVG formation. DailyPriceAction: “A FVG is a one-time use area.” ePlanet Brokers: 70-80% of FVGs eventually fill over longer timeframes, fresh FVGs more reliable. Used for session-specific FVG formation timing. Source quality: mixed. Educational trading content from brokers and community sites. Session volume percentages are consistent with BIS and industry data. Individual trading claims are not independently verified.
- VPS provider operational data (commercially motivated). CPU benchmarks (3-8% for well-optimized scanners, 50-60% spikes during news events), RAM figures (MT4 15-45 MB idle, MT5 100-200 MB with community features disabled), max bars impact (512K to 5K = 1 GB to ~25 MB from ForexFactory tests), Market Watch cleanup recommendations, portable mode configuration. AccuWebHosting diagnostic guide flags 100,000+ chart objects as performance issue. MQL4Solutions warns about slow object creation. Used across resource requirements, deployment checklist, and object accumulation sections. Source quality: technically accurate but commercially motivated. Figures are directionally consistent with MQL5 Forum community reports.
- MQL5 documentation. SendNotification() (255-character limit, rate-limited to 2/sec and 10/min), SendMail() SMTP configuration, WebRequest() for Telegram Bot API, ObjectCreate() with OBJ_RECTANGLE, ObjectsDeleteAll() with prefix parameter, SymbolSelect(), EventSetTimer(), CCanvas class. MqlRates struct size (60 bytes). Used throughout for function specifications and alert configuration. Source quality: primary platform documentation.
Editorial Note
This article covers VPS infrastructure for running Fair Value Gap scanner EAs. It is not financial advice. No claim is made that FVG-based trading strategies produce profitable outcomes, and no specific trading approach is recommended. The academic finding that 30 to 45 percent of detected FVGs fail to produce tradeable reactions is cited as context for why filtering matters, not as a prediction of future performance.
The Kondapally (2026) study analyzing 32,202 FVG events is published in a smaller, newer journal (World Journal of Applied Mathematics and Statistics) with some editorial irregularities noted during review. The statistical methodology is sound and the Python implementation is publicly available on GitHub for reproducibility, but the findings should be treated with moderate confidence until replicated in a more established publication.
Edgeful’s FVG fill rate data (60-63% unfilled within session) is from a trading analytics platform. The underlying methodology is not fully disclosed. The figures are directionally consistent with practitioner estimates but should not be treated as independently verified benchmarks.
CPU and RAM consumption figures combine MQL5 Forum developer measurements with VPS provider benchmarks. The provider data originates from commercially interested sources. Figures are directionally consistent with independent community reports but represent reference ranges, not guaranteed specifications. Actual consumption varies by broker, instrument count, scanner code quality, and MetaTrader build version.
Product ratings, review counts, and pricing from MQL5 Market and CodeBase were verified as of March 2026. The MQL5 marketplace updates frequently. Confirm current availability and version numbers before purchasing or deploying.