
Introduction
One of the most reliable instruments in a trader’s toolbox is RSI divergence. Why? Because it frequently shows up right before significant market turning points, providing traders with an early warning that a trend may be waning. Despite the fact that no signal is flawless, swing and day traders have come to love RSI divergence because of its ease of use and potential strength. To support uninterrupted analysis of momentum-shifts and ensure your charting tools are running reliably, many traders host their systems on a dedicated forex VPS for low-latency performance.
This post will explain what RSI divergence is, how to spot it on charts, and when it’s useful. We’ll describe the distinction between hidden and regular divergence, explain why and when divergence doesn’t work, and demonstrate how to use it in conjunction with other tools to improve accuracy. Even a real case study will be shown to you, along with a helpful checklist to help you verify signals.
What Is RSI Divergence?
Relative Strength Index, or RSI, is a momentum oscillator that calculates the rate at which prices are rising or falling over a predetermined time frame, usually 14 periods. An asset is typically overbought if its reading is above 70, and oversold if it is below 30.
When the price and RSI move in opposing directions, this is known as divergence. This discrepancy frequently indicates that the present trend may be waning, paving the way for a possible reversal.
There are two primary types of RSI divergence:
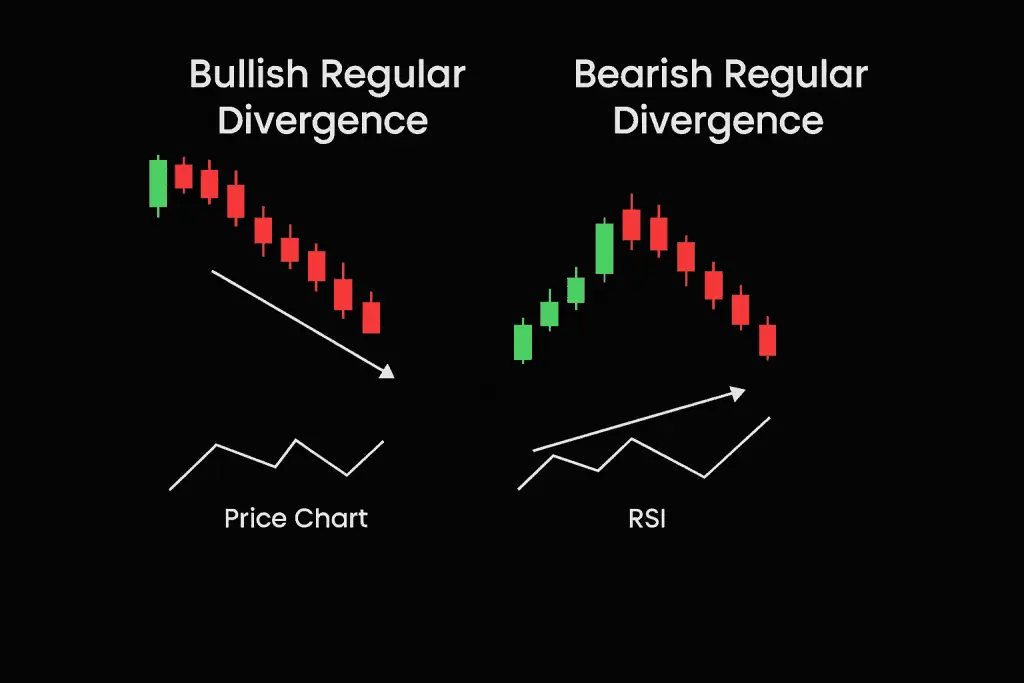
- Regular Divergence: This signals a potential trend reversal. It occurs when the price makes a new high or low, but RSI fails to confirm it.
- Example: In bullish regular divergence, price makes a lower low, but RSI makes a higher low—indicating that sellers are losing strength.
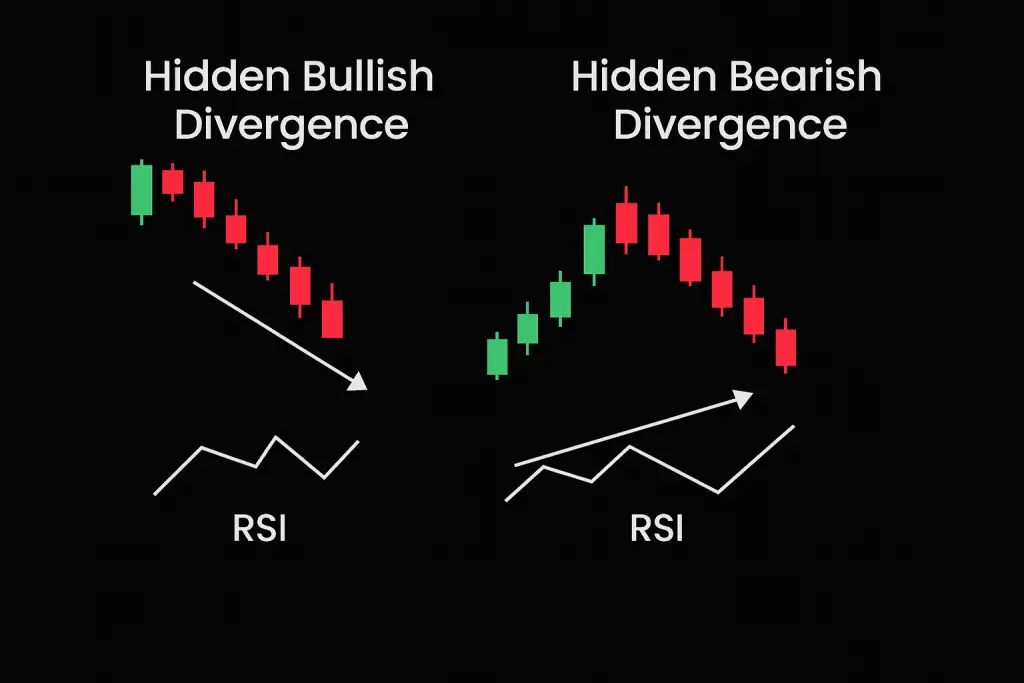
- Hidden Divergence: This typically signals trend continuation. It occurs when the price makes a higher low (in an uptrend) or lower high (in a downtrend), while RSI makes a deeper retracement.
- Example: In hidden bullish divergence, price makes a higher low while RSI makes a lower low—suggesting the uptrend still has fuel.
In short, regular divergence warns of a reversal, while hidden divergence implies continuation.
Types of RSI Divergence
Bullish Regular Divergence appears when the price makes lower lows, but RSI makes higher lows. This suggests momentum is shifting upward.
Bearish Regular Divergence happens when the price makes higher highs, but RSI makes lower highs. It suggests buying pressure is weakening.
Hidden Bullish Divergence shows up in uptrends when the price makes a higher low, but RSI makes a lower low. It’s often a sign that the trend will continue.
Hidden Bearish Divergence occurs in downtrends when the price makes a lower high, but RSI makes a higher high—hinting at continued downside.
RSI Divergence vs. Overbought/Oversold Signals
To time trades, a lot of traders only use the RSI crossing above 70 or below 30. However, these “extreme” readings can be deceptive, particularly during strong trends when the RSI may stay overbought or oversold for extended periods of time.
Divergence offers a more complex signal and frequently manifests prior to the start of a trend reversal. Divergence is a more forward-looking indicator since traders are analyzing market momentum in real time rather than responding to a fixed threshold.
How to Identify and Confirm RSI Divergence
Although RSI divergence can be a useful tool for predicting possible trend reversals, it is most effective when used in conjunction with other tools. To identify and validate a trustworthy signal, take the following actions:
Step 1: Identify Recent Highs or Lows in Price
- Scan the chart for significant peaks (in uptrends) or troughs (in downtrends).
- Mark any higher highs or lower lows that stand out.
Step 2: Compare With RSI Indicator
- Check if the RSI shows a lower high while price makes a higher high (bearish divergence), or a higher low while price makes a lower low (bullish divergence).
- This mismatch in momentum is the core sign of divergence.
Step 3: Analyze Price Structure
- Determine where the divergence is occurring in the larger trend.
- Look for nearby support or resistance levels, trendlines, or key zones where reversals tend to happen.
Step 4: Add Confirmation From Other Indicators
- Use the MACD to check for supporting momentum signals (e.g., a histogram shift or crossover).
- Volume spikes or candlestick reversal patterns (like bullish engulfing or pin bars) add extra validation.
Step 5: Confirm the Trend Context
- Is the market trending or ranging? Divergence tends to be more reliable in trending environments or when a range is at its limit.
By following these steps and looking for confluence, you reduce the chances of acting on a false signal and improve your timing and confidence when entering a trade.
Comparative Analysis of RSI Divergence vs. Traditional RSI Signals
| Aspect | RSI Divergence | Traditional RSI Overbought/Oversold |
|---|---|---|
| Definition | Occurs when the price and RSI move in opposite directions, indicating a potential trend reversal or continuation. | Identifies overbought (RSI > 70) or oversold (RSI < 30) conditions, suggesting potential price reversals. |
| Types | Regular Divergence: Suggests a potential trend reversal.<br> – Hidden Divergence: Indicates trend continuation. | Not applicable; relies solely on RSI crossing predefined thresholds. |
| Signal Timing | Often provides early warnings before a trend reversal or continuation occurs. | Signals can be delayed; RSI may remain in overbought or oversold zones for extended periods during strong trends. |
| Reliability | Considered more reliable in identifying potential reversals, especially when combined with other indicators. | Can produce false signals during strong trending markets; less reliable without additional confirmation. |
| Market Conditions | Effective in both trending and ranging markets; particularly useful when price action contradicts RSI movements. | More effective in ranging markets; less effective in strong trending markets where RSI can stay overbought or oversold for prolonged periods. |
| Usage Complexity | Requires analysis of price and RSI patterns to identify divergences; may be more complex for beginners. | Simpler to use; traders look for RSI crossing above 70 or below 30. |
| Confirmation Needed | Often used in conjunction with other technical analysis tools (e.g., support/resistance levels, candlestick patterns) for confirmation. | Should be confirmed with other indicators or analysis methods to improve reliability. |
| Example Scenario | Bullish Regular Divergence: Price makes lower lows while RSI makes higher lows, indicating weakening downward momentum.<br> – Bearish Regular Divergence: Price makes higher highs while RSI makes lower highs, signaling potential reversal. | RSI crosses above 70: Asset is considered overbought; potential for price to decrease.<br> – RSI crosses below 30: Asset is considered oversold; potential for price to increase. |
When RSI Divergence Works Best (and When It Fails)
Divergence tends to work better on higher timeframes (like 1-hour or daily charts) and in trending markets where price makes clear swings. In choppy, sideways markets, it often gives false signals.
Common reasons divergence fails include:
- Price breaking out due to strong fundamental news.
- RSI reacting too slowly in fast-moving markets.
To reduce false signals, always look for confluence—multiple pieces of evidence supporting your trade idea.
Divergence in Trending vs. Ranging Markets
Divergence behaves differently depending on the market condition:
- In Trending Markets: Divergence against the trend often leads to small pullbacks rather than full reversals. For example, bearish divergence in a strong uptrend might result in a brief correction before the trend resumes.
- In Ranging Markets: Divergence is more reliable and often precedes major reversals. Since price oscillates between support and resistance zones, divergence offers a stronger signal.
Adapt your approach based on the context: caution in trends, confidence in ranges.
Case Study: Apple’s RSI Divergence in October 2023
In October 2023, Apple Inc. (AAPL) experienced a notable price decline, reaching a low near $165. This downturn was influenced by broader market volatility and concerns over U.S.-China trade tensions, which impacted investor sentiment .
Despite the declining price, technical indicators began to signal a potential reversal. The 14-day Relative Strength Index (RSI), a momentum oscillator that measures the speed and change of price movements, formed a higher low compared to its previous trough. This divergence between the RSI and the price action is known as bullish regular divergence, suggesting that the downward momentum was weakening and a reversal might be imminent.
Further supporting this analysis, the Moving Average Convergence Divergence (MACD) indicator showed signs of bullish momentum. The MACD histogram started to rise, indicating that the short-term momentum was gaining relative to the long-term momentum, even though a bullish crossover had not yet occurred .
Additionally, the price action formed a bullish engulfing pattern on the daily chart, a candlestick pattern where a larger white candle completely engulfs the previous day’s black candle, signaling a potential bullish reversal. This pattern occurred near a significant support level that had previously acted as a price floor earlier in the year, adding further weight to the bullish case.
Volume analysis also indicated increased buying interest. There was a noticeable uptick in trading volume during the formation of the bullish engulfing pattern, suggesting that institutional investors might be accumulating shares at this support level.
Traders who recognized this confluence of bullish signals—RSI divergence, MACD histogram rise, bullish engulfing pattern, and increased volume—could have considered entering a long position. A prudent entry point would be just above the high of the bullish engulfing candle, with a stop-loss placed below the recent swing low to manage risk.
Following this setup, AAPL’s stock price experienced a significant rally, climbing to approximately $185 over the next two weeks. This move represented a gain of about 12%, validating the effectiveness of using RSI divergence in conjunction with other technical indicators to identify potential trend reversals.
Case Study: How RSI Divergence Predicted a Recent Reversal in EUR/USD
Between April 22 and 26, EUR/USD created lower lows in price (1.0650 to 1.0602), but RSI made higher lows (28 to 35)—a classic bullish divergence.
Additional signals:
- Price approached key support near 1.0600
- Bullish engulfing pattern on the 4H chart
- RSI rose above 40 with volume confirmation
Result: A rally to 1.0750 over five sessions (+150 pips).
Tips for Trading RSI Divergence
- Use divergence as a setup, not a stand-alone signal.
- Always confirm with trendlines, key zones, MACD, or candlestick patterns.
- Place stop-losses beyond recent extremes to avoid shakeouts.
- Avoid trading divergence in low-volume or choppy markets.
- Start with demo accounts to practice spotting divergence in real time.
Why Divergence Fails and How to Avoid It
Even with perfect divergence, the price may continue in the same direction. Reasons include:
- Strong trend overpowering momentum signals
- News-driven moves
- Lack of confirmation from price or volume
To filter out weak setups:
- Wait for confirmation from other indicators
- Prioritize divergence at key support/resistance zones
- Don’t trade divergence in isolation
Common Mistakes When Trading RSI Divergence
Despite being a very effective tool, many traders abuse RSI divergence because they don’t understand it or rely too much on the signal. Premature entries can result from identifying divergence too soon and making a trade before confirmation. Ignoring the general trend is another mistake; attempting to trade a countertrend divergence in a market with strong directionality can be dangerous and frequently leads to losses. Furthermore, some traders overlook timeframes; divergence on a 5-minute chart may not be significant on a 1-hour chart. Always make sure your divergence setup is in line with the overall market structure to steer clear of these pitfalls, and use supporting indicators to confirm your trade idea.

Divergence Confirmation Checklist
- Is the divergence clear (higher high/lower high vs lower RSI)?
- Is it happening at key support/resistance or trendlines?
- Are candlestick patterns confirming?
- Is MACD or volume supporting the reversal?
- Is the market trending (not ranging)?
The more boxes you check, the stronger the signal.
Summary
RSI divergence is a valuable tool for identifying potential reversals, but it’s not magic. It shines when combined with other forms of analysis like price action and trend structure. It works best in clean, trending markets and becomes more powerful on higher timeframes.
Avoid using it alone and don’t chase every divergence—filter your trades and backtest your approach. With practice and the right tools, RSI divergence can become a key part of your trading edge.
FAQs
What is the most reliable RSI divergence?
The most reliable RSI divergence is the kind that shows up when price and momentum are completely out of sync—specifically, regular bullish or bearish divergence. For example, when the price keeps falling but the RSI starts rising, it’s often a sign that the selling pressure is losing strength and the trend might reverse. This is especially dependable when it happens near important support or resistance levels. While no signal is perfect, this type of divergence tends to give the clearest heads-up that something’s about to change in the market.
Can RSI divergence be used alone?
RSI divergence can definitely give you useful insights, but it shouldn’t be used all by itself. It’s more like a warning light than a full decision-making tool. Divergence might tell you that momentum is slowing down, but it won’t tell you when exactly the price will reverse—or if it even will. To avoid false signals, it’s a good idea to look at other parts of the chart, like trend direction, support and resistance, or candlestick patterns, before making a move.
Which indicator works best with RSI divergence?
A good match for RSI divergence is any indicator that gives more context about trend or momentum. A lot of traders like to use something like MACD to confirm what RSI is saying, especially since both look at momentum in slightly different ways. Volume indicators also help, because if a divergence is happening but there’s no real change in volume, it might not mean much. The goal is to find something that either confirms the divergence or helps filter out weak signals.
Does divergence work for day trading?
Yes, divergence can work well for day trading, but you need to be quick and careful. On shorter timeframes, price moves fast and signals can come and go quickly, so you’ll want to spot divergence early and have a clear plan. It can help you catch reversals or avoid entering when a trend is about to weaken. Just remember to confirm the setup with other clues, like volume or key price levels, since things move fast during the trading day and false signals are common.
Sources
https://www.babypips.com/learn/forex/relative-strength-index
https://school.stockcharts.com/doku.php?id=technical_indicators:relative_strength_index_rsi
https://www.investopedia.com/terms/m/macd.asp
https://www.investopedia.com/terms/r/rsi.asp