
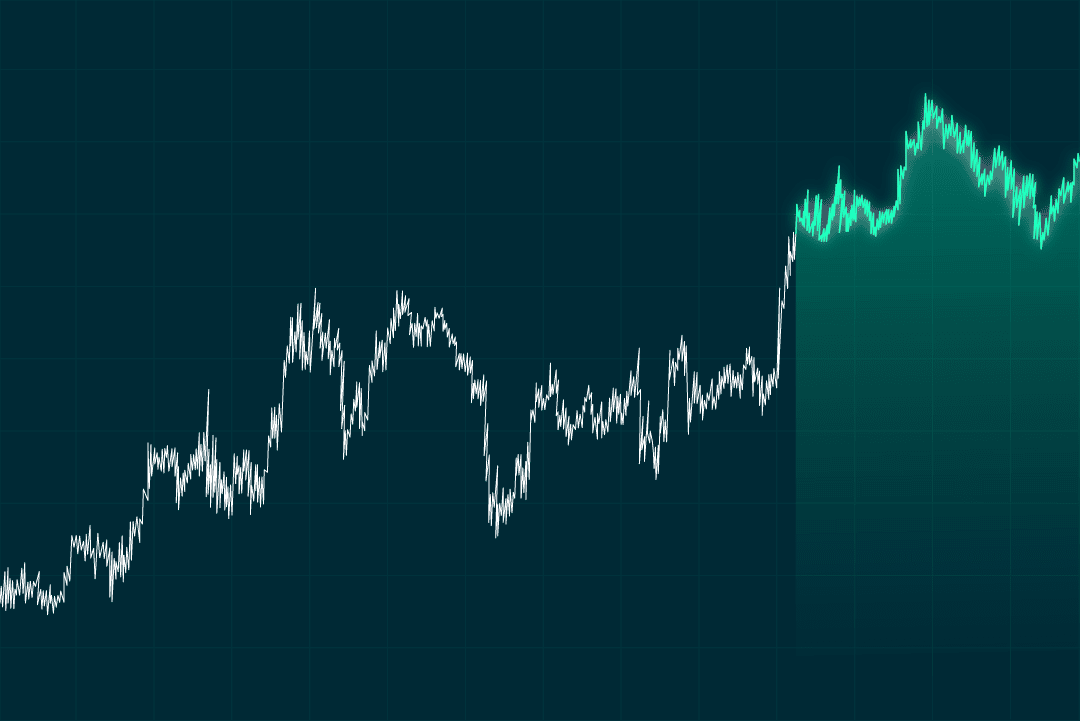
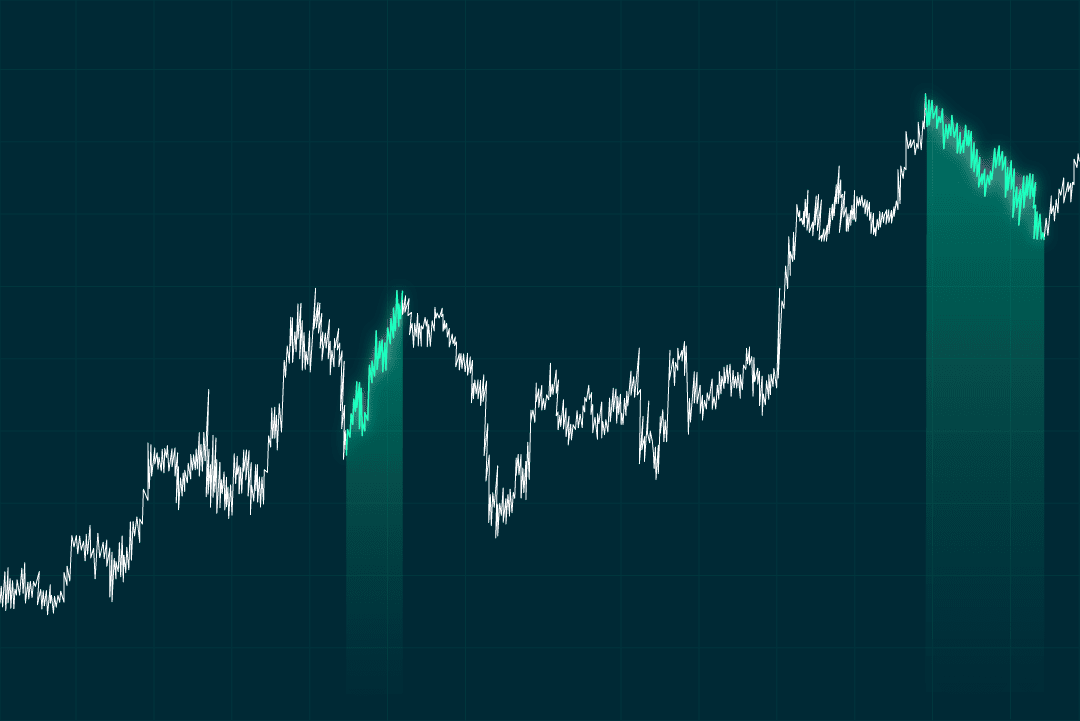
After trading for a while, an experienced trader should start noticing and paying attention to stock market charts. By analyzing these trading charts, you can identify patterns and trends, which will help you make better investment decisions.
Some investors use them to predict entry and exit times, help manage risks, and find the best times for investing. In this article, we’ll explain why trading chart patterns are important, go over the most common patterns, and help you start identifying them on your own. We’ll also talk about using VPS to avoid network interruptions and explain what Forex VPS is.
The Importance of Chart Patterns in Trading
While there’s luck involved in any trading and investments, pro traders don’t rely only on their gut feelings about where and when to invest. Tracking stock market charts is a common strategy used in trading.
The three main benefits of tracking patterns are
You can predict when a trend is about to reverse
Certain patterns might help you notice when price trends are about to change from positive (bullish) to negative (bearish), and vice versa. These trends reflect investor attitudes toward a particular market.
For example, in a head and shoulders pattern (when there is an increase in price, a drop below a previous trough, a peak, another drop, and then another increase, usually followed by a big drop), you can expect a bullish-to-bearish trend reversal.
It gives you a better idea of entry and exit points
Stock chart patterns can help you better understand when to enter and exit the market. In the example of the head and shoulders pattern, the most common entry point is when the price breaks below the neckline after forming the right shoulder.
To exit, you should measure the distance from the top of the head to the neckline, then project this distance down from the neckline breakpoint.
It helps manage risks
Stock market chart patterns often come with built-in levels for setting stop-loss orders. The structure of a pattern can suggest logical places to put stops to limit potential losses.
Common Stock Chart Patterns Explained
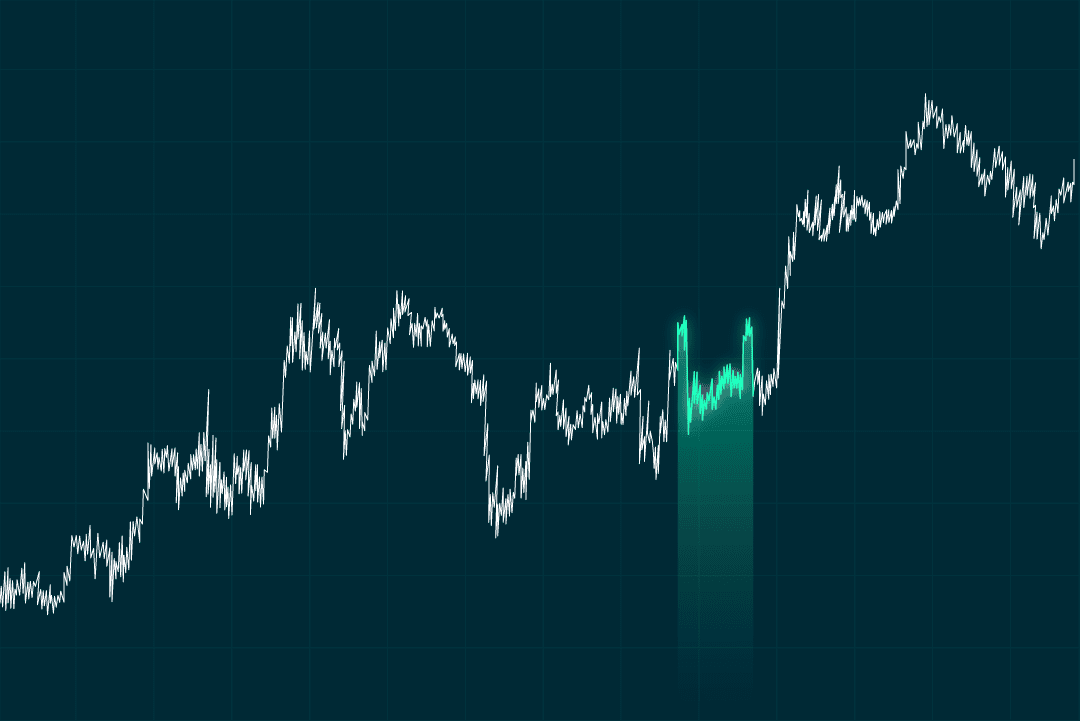
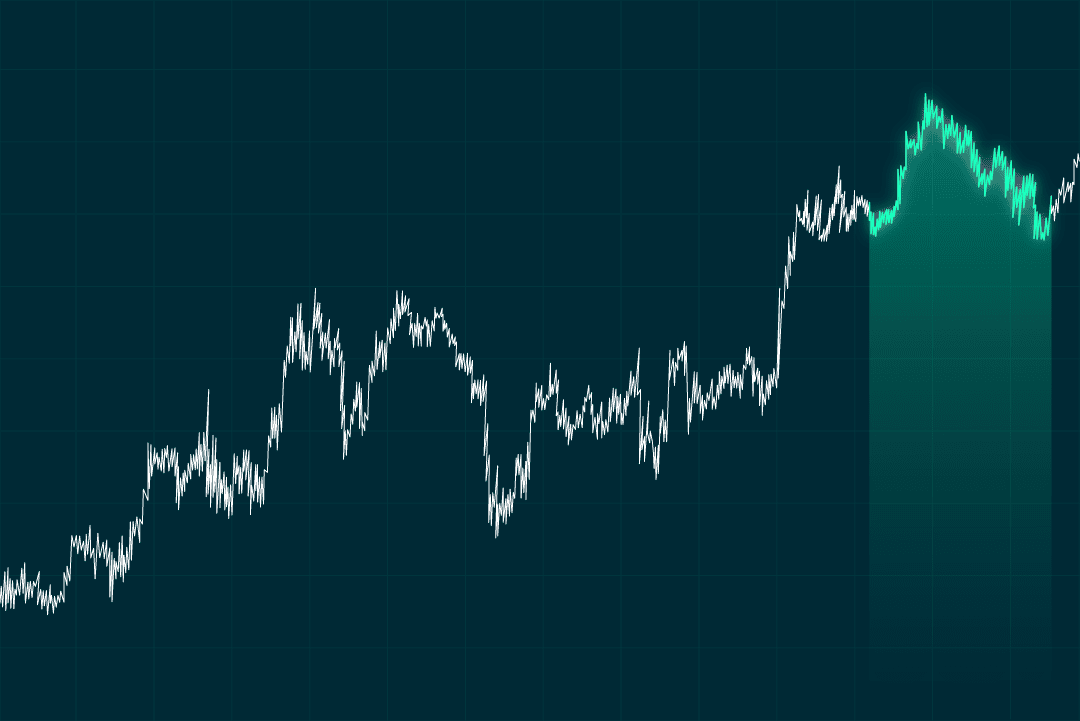
There are many different stock patterns. You can find chart patterns based on various timelines, ranging from daily to monthly trading and even longer periods. When you open a chart, you’ll see multiple bars, known as candlesticks. They represent price movements over time. The thick part of the candlestick represents the opening and closing prices. Thin lines or wicks show the high and low prices.
Head and shoulders
As we mentioned before, the pattern is made up of an increase in price, a drop below a previous trough, a peak, and another drop. Then there’s another increase, followed by a big drop. It signals that trends are reversing to the negative or bearish.
Inverse head and shoulders
This pattern looks like an upside-down head and shoulders. It forms after a downtrend. The left shoulder is a low point in the downtrend. The head goes even lower, forming the bottom of the pattern. The right shoulder is another low, but not as low as the head. Inverse head and shoulders usually shows a reversal from a downtrend to an uptrend.
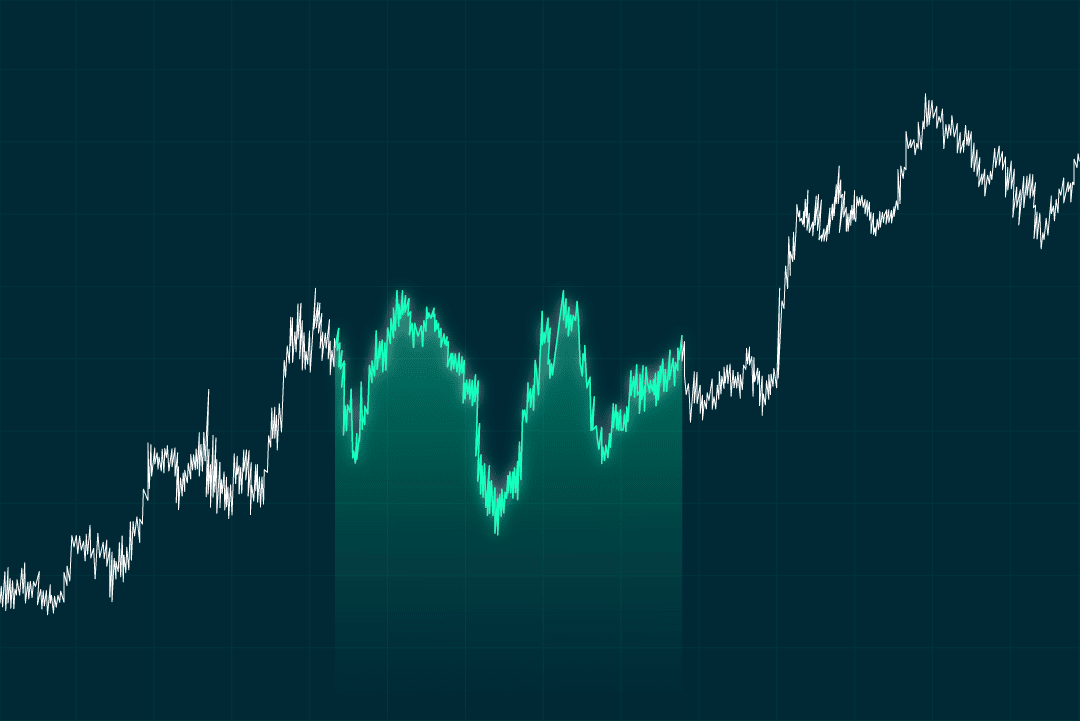
Double top
The pattern has two peaks next to each other at about the same price level. It’s usually a bearish reversal pattern. If the price falls below the support level between the peaks, it suggests a downtrend.
Double bottom
It has two low points next to each other at a similar price level. If the price rises above the resistance level between the troughs, it suggests an upward trend may begin.
Triangle patterns
There are three triangle stock patterns: ascending, descending, and symmetric. These are continuation patterns, which means they tend to continue the trend that was in place before the pattern formed.
- An ascending triangle (flat top, rising bottom) usually means a positive trend.
- The descending triangle (flat bottom, falling top) is usually bearish.
- A symmetric triangle means that the direction depends on the breakout.
Identifying Trading Patterns for Beginners
Identifying chart patterns takes time and practice. Once you can visualize and name a pattern, you can look at the historical trading chart patterns to see how they worked in the past.
We recommend you go over multiple historical chart patterns to train your eye. Once you are confident in your skills, try to analyze current trading patterns to confirm trends. Try this with different time periods. When you feel comfortable, you can start trading. However, you should always keep in mind the risks involved in trading your money and try to manage them as much as possible.
To start trading, you’ll need to find a reliable stockbroker and download a trading platform where you can track patterns and trends. However, trading can get a bit hectic, especially during peak times of activity. That’s why a Virtual Private Server (VPS) hosting service can be a great way to handle network fluctuations.
A service like Forex VPS lets you host all your trading activity on a private server. This means lower latency, fewer interruptions, and greater security.
Contextual Confirmation Strategies
Recognizing a chart pattern is just the first step – the real skill comes in confirming whether the pattern is reliable before placing a trade. Many beginners rush into trades based solely on visuals and end up getting caught in false breakouts or failed setups.
Here are three powerful confirmation strategies to improve accuracy and confidence when trading chart patterns.
1. Volume Confirmation
Volume plays a critical role in validating breakouts from chart patterns. When price breaks out of a structure like a triangle, flag, or head-and-shoulders pattern, the strength of the breakout often depends on trading activity.
How to Use It
- Look for above-average volume when price breaks a trendline or neckline.
- If a breakout occurs on low volume, the move may lack conviction and could reverse quickly.
- Continuation patterns (e.g., flags, pennants) are especially reliable when breakout volume spikes compared to recent sessions.
Example:
In an ascending triangle, a breakout above resistance with 50–70% higher volume than the prior candles suggests strong buying pressure and increases the likelihood of follow-through.
2. Support & Resistance Alignment
Chart patterns are more reliable when they form near significant support or resistance levels. These key zones act as decision points where market participants react strongly.
How to Use It
- Confirm that the breakout aligns with a major price level visible on higher timeframes.
- When a bullish breakout happens above a well-established resistance, it signals increased demand and potential trend continuation.
- Conversely, breakdowns below strong support levels often indicate a deeper trend reversal.
Example:
If you spot a double top forming just below a multi-month resistance level, the odds of a successful bearish reversal increase significantly.
3. Momentum Indicators for Pattern Confirmation
While chart patterns are powerful, combining them with momentum indicators provides an extra layer of validation.
Best Indicators to Use
- RSI (Relative Strength Index):
- Use RSI to confirm whether momentum supports the breakout direction.
- Example: An RSI above 50 during a bullish breakout adds confidence.
- MACD (Moving Average Convergence Divergence):
- Check for bullish or bearish crossovers to confirm trend strength.
- Stochastic Oscillator:
- Useful for spotting potential reversals when patterns form in overbought or oversold zones.
Example:
If a symmetrical triangle breaks upward and MACD shows a bullish crossover, the confluence of signals strengthens the trade idea.
Quick Checklist for Pattern Confirmation
Before acting on a chart pattern, run through this mini-checklist:
| Confirmation Factor | Why It Matters | Action to Take |
|---|---|---|
| Breakout Volume | Confirms trader interest | Look for above-average volume |
| Key Price Levels | Validates breakout strength | Check higher timeframe support/resistance |
| Momentum Alignment | Confirms trend strength | Use RSI/MACD to support the move |
| Candle Close Beyond Level | Avoids fakeouts | Wait for a confirmed breakout candle |
Pattern Risk Management Tips
Even the most reliable chart patterns don’t guarantee success. To protect your capital and maximize potential gains, you need a risk management plan built around your trading setups. Poor risk control is one of the top reasons beginners fail, especially when trading patterns where false breakouts are common.
Here are three essential risk management techniques to apply when trading chart patterns.
1. Setting Effective Stop-Loss Levels
A stop-loss is your safety net – it automatically closes your trade when price moves against you beyond a certain point. Placing your stop strategically is critical when trading patterns.
How to Place Stop-Loss Orders
- Outside the Pattern Boundary:
Set your stop just beyond the pattern’s key structure.- For ascending triangles, place the stop below the lower trendline.
- For double tops, position the stop above the pattern’s peak.
- Allow Breathing Room:
Don’t set stops too close to the breakout point – natural price fluctuations might trigger them prematurely. - Adjust Based on Volatility:
Use the Average True Range (ATR) indicator to calculate a reasonable buffer zone.
2. Defining Clear Profit Targets
Without predefined profit targets, traders often exit too early or hold losing trades for too long. Chart patterns make this easier since many have predictable price objectives.
How to Set Profit Targets
- Measure the Pattern Height:
- For continuation patterns like triangles or flags, measure the vertical distance between the highest and lowest point within the pattern.
- Project that distance from the breakout point to estimate the profit target.
- Use Multiple Targets for Scaling Out:
- Set a primary target based on the pattern’s height.
- Set a secondary target near the next significant support or resistance level.
- Lock in Partial Profits:
If price hits your first target, consider closing part of your position and moving the stop-loss to breakeven.
Example:
If a descending triangle is 50 pips tall, and price breaks below support, your first target would be approximately 50 pips lower than the breakout level.
3. Position Sizing Based on Risk
Managing position size ensures that even if a trade fails, your account stays safe.
How to Calculate Position Size
- Decide Your Risk per Trade:
- Typically 1–2% of account balance.
- Measure Stop-Loss Distance:
- Example: If your stop is 40 pips away and you risk $50, calculate the lot size accordingly.
- Adjust Based on Volatility:
- Use smaller sizes when trading volatile patterns like wedges or head-and-shoulders formations.
This approach keeps your losses manageable while allowing winners to compound over time.
4. Avoid Overtrading Patterns
Many beginners make the mistake of jumping into every pattern they spot. Instead:
- Focus on high-probability setups confirmed by volume and momentum (as covered in the previous section).
- Limit the number of open trades at once to avoid excessive exposure.
- Keep a trading journal to analyze which patterns and timeframes give you the best win rates.
Quick Risk Management Checklist
Before entering any trade based on a chart pattern, ask yourself:
| Question | Why It Matters | Action |
|---|---|---|
| Where is my stop-loss? | Protects capital | Place it just beyond pattern boundaries |
| What’s my profit target? | Locks in gains | Use measured pattern height or key levels |
| How much am I risking? | Prevents big losses | Risk ≤ 1–2% per trade |
| Is the setup confirmed? | Avoids false signals | Use volume, support/resistance, momentum |
| Am I overexposed? | Reduces account risk | Limit total open positions |
FAQ
How can chart patterns help in trading?
Chart stock patterns can help a lot to:
- Identify market trends and attitudes
- Find the best entry and exit points
- Manage risks
- Understand crowd psychology in the market
What are the most common stock chart patterns?
- Head and shoulders
- Inverse head and shoulders
- Double top and double bottom
- Cup and handle
- Triangle trading patterns
- Flag and pennant
- Wedge
How do I identify chart patterns in trading?
- First, get to know the chart patterns through visual aids.
- Practice with historical data to recognize how certain patterns worked in the past.
- Choose your timeframe such as intraday, daily, weekly, or monthly trading charts. Try experimenting with different timeframes to recognize how patterns reflect over time.
- Identify the overall trend whether it’s up, down, or sideways to narrow down the possible patterns. Before making any investment decision, you should always confirm a pattern.
- Regularly review charts to spot patterns.
- Understand the broader market conditions and how they might affect patterns. It’s not enough to track patterns, you should also follow market and global news.