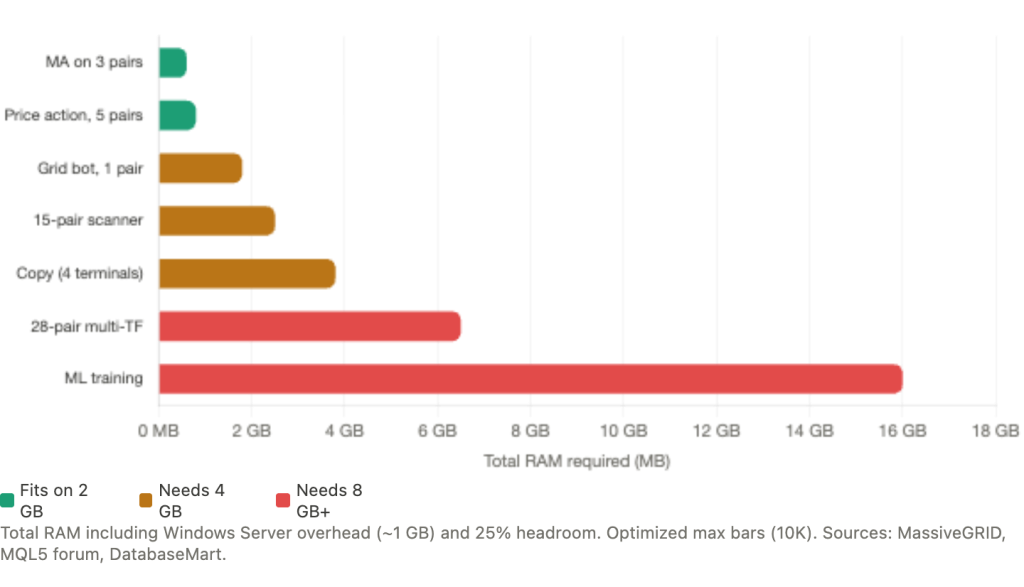
A simple moving average crossover EA on three pairs needs roughly 500 MB of RAM. A multi-timeframe scanner across 28 pairs can devour 4 to 8 GB. The difference between these two strategy types determines whether a trader spends $15/month or $75/month on VPS hosting, yet most traders guess their requirements rather than sizing them from actual resource data.
This article maps specific strategy types to specific VPS tiers using the most detailed benchmark figures available from MQL5 developer forums, VPS provider production data, and real trader configurations. The goal is straightforward: match your EA’s resource footprint to the cheapest VPS plan that runs it reliably.
The data reveals something most traders do not expect. Three variables dominate memory consumption: the “Max bars in chart” setting, the number of chart windows open, and the number of terminal instances running. The actual EA code, the strategy logic itself, matters far less than the environment it runs in. A well-optimized multi-pair scanner can run on a 2 GB VPS. A poorly configured single-pair EA can crash one.
This means the first question is not “how complex is my strategy?” It is “how many charts, how many symbols, and what is my max bars setting?” Answer those three questions, and the VPS tier follows directly.
The Resource Budget Starts with What Windows Takes
Before any trading software launches, the operating system claims its share. Windows Server on a VPS consumes 800 MB to 1.2 GB of RAM. On a 2 GB plan, that leaves roughly 800 MB to 1.2 GB for MetaTrader and everything else. On a 4 GB plan, you have 2.8 to 3.2 GB to work with. This fixed overhead is the single most important constraint traders underestimate when sizing a VPS.
MT4 and MT5 have meaningfully different baselines on top of that OS overhead. A bare MT4 terminal with no charts open uses 150 to 200 MB according to MassiveGRID production benchmarks, though MQL5 forum developers have measured instances as low as 30 to 100 MB with aggressive optimization. MT5 runs heavier at 250 to 350 MB idle, largely because it loads richer market data by default and runs as a 64-bit process. MetaQuotes CEO Renat Fatkhullin confirmed this design philosophy on the MQL5 forum: MT5 was built to “use the available memory, rather than trying to shrink to 100-200 MB,” targeting systems with 4 to 64 GB of RAM.
Each open chart window adds memory on top of the platform baseline. MassiveGRID documents 30 to 50 MB per chart for MT4 and 40 to 70 MB per chart for MT5 on higher timeframes. But timeframe matters enormously. M1 charts load 1,440 bars per day versus 6 bars per day for H4, creating an order-of-magnitude difference in memory consumption. WinnerVPS documented M1 charts with EAs consuming up to 300 MB each.
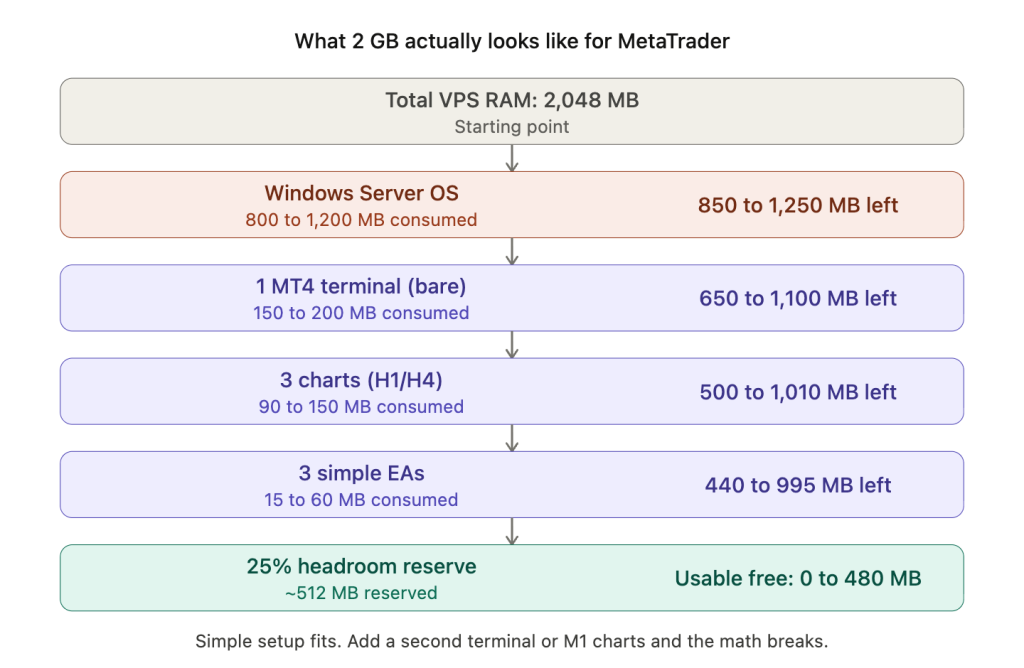
Here is what actually happens on a 2 GB VPS running one MT4 terminal with a simple setup:
Windows Server takes 800 MB to 1.2 GB, leaving 800 MB to 1.2 GB. One bare MT4 terminal takes 150 to 200 MB, leaving 600 MB to 1 GB. Three charts on H1 or H4 with low max bars take 90 to 150 MB, leaving 450 to 900 MB. Three simple EAs take 15 to 60 MB, leaving 400 to 850 MB. Reserving 25% of total RAM as headroom (roughly 200 MB on a 2 GB plan) leaves 200 to 650 MB of usable free space.
This confirms that a 2 GB VPS comfortably handles one MT4 terminal with 3 to 5 simple EAs on higher timeframes. The math works. But push beyond that, add a second terminal, load M1 charts, attach complex indicators, or leave the default max bars setting untouched, and the VPS starts paging to disk. Swap on even NVMe storage is roughly 100x slower than RAM, turning millisecond EA execution into sluggish performance precisely during the volatile moments when execution quality matters most.
Lightweight Strategies That Thrive on Entry-Tier Hardware
Strategies that process infrequently, monitor few symbols, and use built-in indicators define the lightweight category. These run comfortably on 2 GB RAM with 1 to 2 vCPUs at $8 to $25/month.
Moving average crossover EAs sit at the very bottom of the resource curve. Two iMA() calls on a single chart consume negligible CPU and roughly 2 MB of buffer memory. A complete setup with one MT4 terminal, 3 to 5 charts running MA crossover EAs on H1 or H4, totals 400 to 600 MB including all terminal overhead. One MQL5 developer measured a terminal with 2 charts and 1 EA each at just 110 MB and 1 to 2% CPU. This is the benchmark for “as light as it gets” on MetaTrader.
Price action EAs, those detecting pin bars, engulfing patterns, or inside bars, are even lighter because they use zero indicator buffers. All pattern recognition operates on the OHLC arrays that MetaTrader already holds in memory for chart display. The computational cost is a brief comparison on each new bar, effectively zero sustained CPU between bars.
Position trading and swing trading EAs on H4 or D1 timeframes represent the ideal low-resource profile. An H4 strategy produces only 6 new bars per day. A D1 strategy produces one. If the EA checks conditions only on bar close, which is the standard pattern of comparing the current bar time against the previous bar time and acting only when they differ, it fires logic a handful of times daily. Between those moments, the EA consumes zero CPU.
Timer-based strategies using OnTimer() instead of OnTick() deliver a further reduction that is architecturally significant. OnTick() fires on every incoming tick, potentially dozens per second on liquid pairs like EUR/USD during London and New York overlap. OnTimer() set to a 10-second interval sees roughly 1/20th as many events for the same symbol. One trader on the ForexSB forum consolidated 80 strategies into a single portfolio EA using OnTimer() at 10-second intervals, running everything on a single chart and reporting “minimal CPU overhead.” Formal CPU percentage benchmarks for the OnTimer() saving do not exist, but the mechanism is straightforward: fewer events means fewer processing cycles.
The consolidation approach itself is worth noting. Instead of running 10 charts with 10 separate EAs (consuming 300 to 700 MB in chart overhead alone), a single multi-symbol EA runs on one chart and polls other symbols programmatically via OnTimer(). This eliminates per-chart memory overhead entirely. The tradeoff is more complex EA code, but for traders running many simple strategies, the resource savings can move the entire setup down a VPS tier.
Real traders running on hardware most guides would call insufficient
The most compelling evidence that lightweight strategies fit on minimal hardware comes not from provider marketing but from traders documenting their own setups.
One trader on the MQL5 forum ran 7 MT4 terminals simultaneously on a 1 GB VPS with lean configurations. Another ran 2 live and 5 demo MT4 instances on just 512 MB, each with 4 to 5 charts and a light EA. A ForexFactory user operated 2 live plus 4 demo accounts on a Kimsufi server with a Celeron 1.2 GHz processor and 2 GB RAM for over two years without problems.
These are not recommended configurations. They leave no headroom for memory growth or volatility spikes. But they demonstrate that the resource floor for simple EAs is far lower than VPS marketing suggests. A trader running one MA crossover EA on three H4 charts does not need a 4 GB plan. A 2 GB plan with proper optimization provides comfortable margins.
The Resource Cliff: What Pushes Strategies into the 4 GB Tier
The jump from lightweight to medium resource consumption happens abruptly. A trader running 3 pairs with simple EAs on 2 GB has comfortable headroom. The same trader adding 12 more pairs, or a second terminal instance, or a grid EA that accumulates 40 positions during a drawdown, suddenly needs 4 GB. Three factors drive this cliff.
Multi-pair scanning scales linearly with symbol count
Each additional chart adds 30 to 70 MB of RAM depending on timeframe and max bars settings. A 5-pair scanner in one terminal uses roughly 400 to 600 MB total, still manageable on 2 GB after Windows overhead. But a 15-pair scanner climbs to 1 to 1.5 GB for chart data alone, leaving no headroom on a 2 GB plan. One ForexFactory user documented that loading 23 pairs with M1 data at 500,000 bars consumed approximately 1 GB just from history data, before any indicator calculations ran.
The scaling is predictable but unforgiving. Every additional pair adds the same incremental cost. There is no economy of scale where the 20th pair costs less than the 5th. On MT4, the problem is compounded by indicator duplication: each indicator on each chart creates its own separate data copy. Ten indicators across ten charts produces 100 independent buffer allocations.
Grid and martingale systems hit a different wall
Grid and martingale EA code is typically light. The logic for placing and managing grid levels is computationally simple. The resource problem is not the code but the positions it accumulates. During adverse moves, these strategies can open 30 to 50+ positions, each requiring order management on every tick: trailing stop checks, modification evaluations, and OrderSelect() loops iterating through the entire position list.
NYC Servers documented a 5-pair grid EA requiring “2 GB minimum for running MT4 with five charts, 4 GB gives breathing room for indicators.” The breathing room matters because grid systems accumulate the most positions during volatile conditions, which is precisely when tick volume spikes 5 to 10x and CPU demand rises from every other EA on the VPS simultaneously.
The operational risk is distinct from other strategy types. A trend-following EA that misses a tick during high volatility might enter slightly late. A grid EA that goes offline during a deep drawdown cannot add recovery positions or adjust levels, turning a managed drawdown into an unmanaged one. This makes uptime the primary infrastructure concern for grid systems, not raw speed.
Copy trading multiplies terminal instances
Copy trading setups are the most common reason traders hit the 4 GB wall without expecting it. Running a master plus 3 follower accounts requires 4 MetaTrader terminals plus copier software. At 300 to 700 MB per terminal plus 200 to 400 MB for the copier application, total RAM demand reaches 2.5 to 5.5 GB before Windows overhead. MassiveGRID recommends their 4 to 8 GB tier for copy trading configurations.
The resource consumption is straightforward multiplication. Each follower account is a full terminal instance with its own chart data, indicator calculations, and tick processing. There is no way to run multiple MT4 trading accounts in a single terminal instance. Each account requires its own terminal, its own installation directory, and its own portable mode configuration.
Indicator-heavy strategies create cumulative overhead
Custom indicators with many buffers can push memory consumption past what the EA code alone would suggest. The official MQL5 documentation provides the formula: buffers multiplied by max bars multiplied by 8 bytes per indicator instance.
A simple moving average (1 buffer) at 10,000 bars costs roughly 80 KB. But a multi-timeframe Trender indicator combining Ichimoku across 5 timeframes requires 41 buffers, totaling approximately 31 MB per chart at 100,000 bars. One ForexFactory user identified specific problem indicators, including Butterworth filters and Schaff Trend Cycle, that “will bog down even the best of computers if not approached correctly.”
A DatabaseMart customer case study provides the verified benchmark for the 4 GB tier: a trader running 7 to 9 EA instances on 2 vCPU with 4 GB RAM reported CPU averaging 7 to 15% with peaks at 50 to 60%, memory consumption at 45 to 60%, and stable operation for over 147 consecutive days. This is the most specific independently documented long-running benchmark available and confirms that 4 GB with 2 vCPU handles a medium-complexity multi-EA deployment reliably.
Heavy Strategies That Demand 8 GB or More
Three categories push resource requirements past what a standard VPS can deliver. Each is heavy for a different reason, and understanding the distinction prevents both overspending and underspending.
Multi-timeframe multi-pair scanners create exponential data demands
Scanning 28 pairs across 4 timeframes produces 112 chart data sets. At 40 to 70 MB each in MT5, that is 4.5 to 7.8 GB for chart data alone, before Windows overhead, before the platform baseline, and before any indicator calculations. This is not a configuration problem that max bars optimization can fully solve. Even at reduced history depth, 112 simultaneous data sets on MT5 consume substantial memory because MT5 maintains its M1 base plus constructed timeframe caches for every active symbol/timeframe combination.
One MQL5 forum user documented deploying a multi-pair scanner using the iSpy indicator approach on MetaQuotes’ own VPS and reported that it “fell apart, as the many charts deployed reach critical RAM allocations, making the iSpy indicator very slow and bypassing signals at critical times.” The MetaQuotes VPS caps at 3 GB, which is simply insufficient for this workload class.
The practical approach for large scanners is either reducing coverage (scanning 10 to 15 pairs instead of 28 to save 50%+ of chart data overhead) or upgrading to 8 GB where the math works with headroom. Trying to squeeze a 28-pair scanner onto a 4 GB plan creates the worst possible outcome: a system that works during quiet markets and fails during volatile ones when memory pressure from tick surges pushes the VPS into swap.
Machine learning EAs split into two very different resource profiles
Training and inference are fundamentally different workloads, and conflating them leads to either unnecessary infrastructure spending or dangerous resource contention.
Training is devastatingly heavy. One developer reported a 4-layer neural network optimization taking hours on an i5 with 4 cores and 8 GB of RAM. A reinforcement learning EA optimization took 28 hours on a 4-core CPU. Training should never run on a live trading VPS. This is not a suggestion. It is a hard operational rule. A training job consuming 100% CPU across all cores for hours will degrade or halt every other EA on the same VPS.
Inference, running a pre-trained model to generate signals, is much lighter. MT5’s ONNX support loads models efficiently, and processing a typical input matrix per bar is computationally modest. Many inference-only ML EAs fit within the 4 GB tier.
The danger zone is self-optimizing EAs that periodically retrain during live trading. One AI EA on the MetaQuotes VPS consumed 809 MB and triggered repeated memory warnings and shutdowns. These EAs need dedicated resources isolated from live execution, either a separate VPS instance or scheduling retraining exclusively during the weekend market close.
Strategy optimization is the heaviest MetaTrader workload by a wide margin
MT5’s Strategy Tester creates one optimization agent per logical CPU core, and each agent consumes substantial memory. Developer benchmarks show approximately 459 MB per agent for a simple iMA strategy optimized over 1 month of data, scaling to approximately 1.78 GB per agent for 1 year of EUR/USD M5 data. A 16-core machine running full optimization needs roughly 28.5 GB just for agent processes. Users with 32 GB RAM and 16-core CPUs report system freezes during large optimization runs.
MetaQuotes explicitly advises using “agents by the number of physical, not logical, kernels. Hyperthreading almost does not help in difficult computational tasks.” This means a 4-core/8-thread VPS should run 4 optimization agents, not 8.
Optimization and backtesting should run on a dedicated instance, never on a VPS hosting live EAs. MetaQuotes’ own built-in VPS disables the Strategy Tester entirely, which is the clearest possible signal about this workload’s incompatibility with live trading infrastructure. A dedicated optimization VPS with 8 to 16 vCPU and 16 to 32 GB RAM at $100 to $400/month serves this purpose. Run optimizations during the weekend, deploy the results to the live VPS, and keep the two workloads completely separated.
The Single Setting That Matters Most: Max Bars in Chart
The “Max bars in chart” setting has more impact on memory consumption than any other single variable, including strategy complexity, indicator count, or EA code architecture. Reducing it from the default to a VPS-appropriate value can reclaim hundreds of megabytes to over a gigabyte of RAM, often enough to move a setup from a 4 GB requirement to a 2 GB plan.
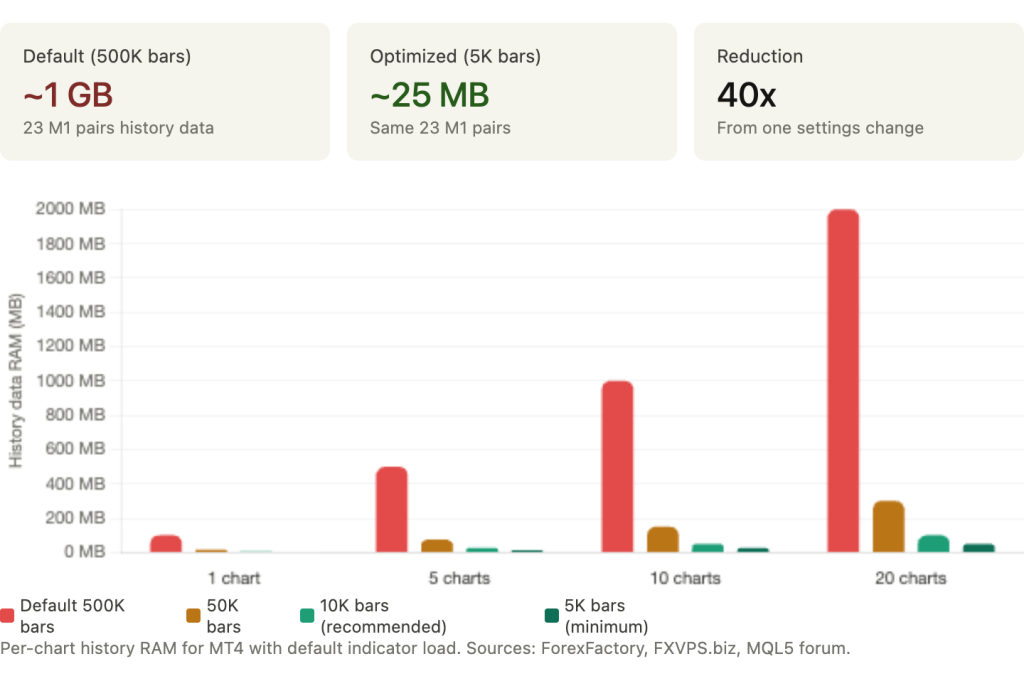
The most dramatic documented example comes from a ForexFactory user who loaded M1 data for 23 pairs at the default 500,000 bars and measured approximately 1 GB of RAM consumed by history data alone. Reducing to 5,000 bars dropped consumption to roughly 25 MB. That is a 40x reduction from a single settings change that takes 10 seconds.
FXVPS.biz documented the per-chart impact: each chart with 500,000 bars loaded uses 50 to 100 MB for history data alone. Across 10 charts, that is up to a gigabyte consumed by historical data that most EAs never reference. A scalping EA using a 20-period moving average on M5 needs 20 bars of lookback. It has no use for the 499,980 additional bars MetaTrader loaded into memory by default.
The technical distinction matters for planning
Two settings control bar limits, and they do different things. “Max bars in history” affects disk usage only. It limits how many bars are saved to .hst files on the VPS drive. “Max bars in chart” limits how many bars are accessible to indicators and EAs in RAM. The second setting is what determines memory consumption. Reducing max bars in history saves disk space. Reducing max bars in chart saves RAM.
A further detail explains why indicator-heavy setups are disproportionately affected. MT4 duplicates bar data per indicator, not per chart. If you attach 10 indicators to 10 charts, MetaTrader creates 100 separate data copies. Each copy consumes memory proportional to the max bars setting. At 500,000 bars, 100 indicator/chart combinations consume an enormous amount of memory. At 5,000 bars, the same 100 combinations are negligible. MT5’s indicator handle sharing partially addresses this duplication by reusing calculations when identical parameters are requested, but the underlying bar data still consumes memory per active chart.
Recommended values for VPS environments
Setting max bars below 5,000 can cause some strategies to break. Hyonix’s VPS guidance identifies 5,000 as the minimum viable value. Below this threshold, indicators with longer lookback periods (100 or 200 period moving averages on lower timeframes) may not have enough data to initialize correctly, producing incorrect signals or failing to load entirely.
For most EAs on a VPS, 10,000 bars is the safe default. It provides more than enough lookback for any standard indicator configuration while keeping memory consumption at a fraction of the default. A 200-period moving average on H4 needs 200 bars. A 200-period MA on M1 needs 200 bars. At 10,000 bars, both have 50x more data than they require.
Never exceed 50,000 bars unless the strategy specifically requires deep historical lookback for calculations such as long-period statistical analysis or multi-year seasonal patterns. If your EA needs 100,000+ bars, that requirement should drive VPS sizing explicitly rather than being inherited from a default setting that most traders never examine.
Before upgrading to a larger VPS plan, check this setting. If it is still at the default 512,000, reducing it to 10,000 may solve the resource problem entirely at zero cost.
Indicator Overhead: The Buffer Math That Explains Everything
The resource cost of technical indicators follows a precise formula documented in the official MQL5 article “Decreasing Memory Consumption by Auxiliary Indicators”: buffers multiplied by max_bars multiplied by 8 bytes per indicator instance.
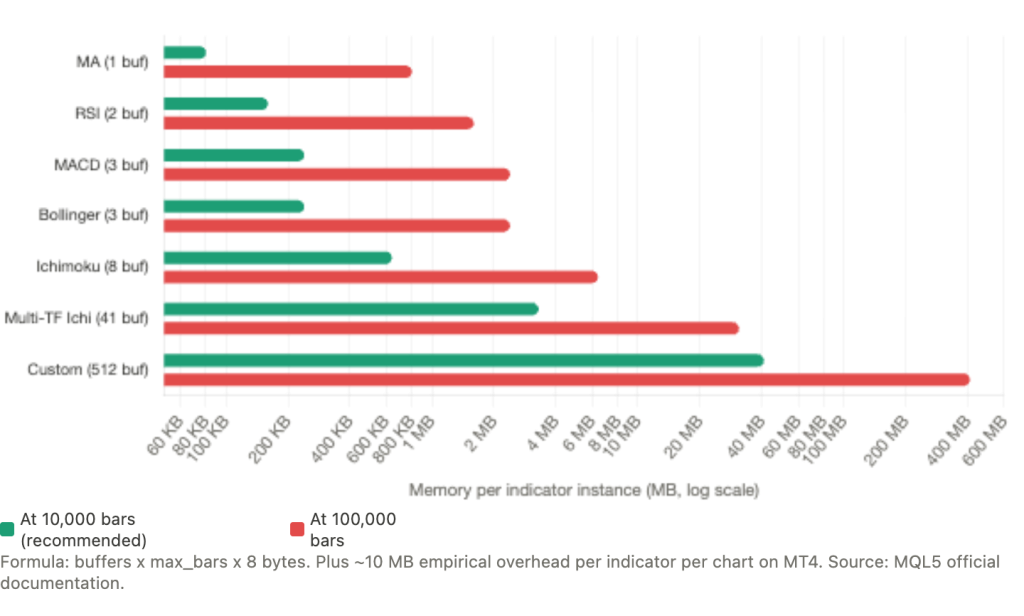
A simple moving average uses 1 buffer. At 10,000 bars, that costs roughly 80 KB. At 100,000 bars, 800 KB. Negligible either way. RSI uses 1 to 2 buffers, costing 80 to 160 KB at 10,000 bars. MACD uses 3+ buffers at 240 KB. Bollinger Bands uses 3 buffers at 240 KB. Ichimoku uses 8 buffers at 640 KB. These are the built-in indicators that most EAs rely on, and individually none of them creates meaningful memory pressure at reasonable max bars settings.
The numbers change when indicators combine multiple timeframes or use many buffers. A documented multi-timeframe Trender indicator combining Ichimoku across 5 timeframes requires 41 buffers, totaling approximately 3.3 MB per chart at 10,000 bars and 31 MB per chart at 100,000 bars. Custom indicators can declare up to 512 buffers, which at 100,000 bars would consume 410 MB per chart. These are not common configurations, but they exist in the MQL5 Market and in custom-developed institutional scanning tools.
The hidden cost beyond pure buffer math
The formula captures buffer memory, but empirical testing reveals additional overhead that the formula does not predict. One MQL5 developer systematically removed indicators one by one from a running terminal and measured “overall memory usage going down by about 10 MB per chart” per indicator, regardless of buffer count. Another developer measured that 10 charts with 3 iStdDevOnArray-based indicators added 300 MB to MT4 memory, far exceeding what the buffer formula alone would suggest.
This additional overhead comes from MT4’s internal data allocation patterns: rate snapshots, internal copies of price data maintained per indicator, and memory fragmentation from repeated allocation and deallocation during indicator recalculation. The practical implication is that the buffer formula provides a useful lower bound but underestimates actual consumption by roughly 10 MB per indicator per chart on MT4.
MT5’s handle sharing changes the economics
MT5 provides a meaningful efficiency gain that MT4 cannot match. When two EAs on the same symbol and timeframe call iMA(EURUSD, H1, 14) with identical parameters, MT5 calculates only one instance and shares the result. MT4 creates separate calculations for each call, doubling both memory and CPU consumption. For setups running multiple EAs that use overlapping indicators on the same pairs, MT5’s sharing mechanism can reduce total indicator memory by 30 to 50% compared to the equivalent MT4 configuration.
The efficiency requires correct implementation. The IndicatorRelease() function must be called when indicator handles are no longer needed, or orphaned calculations persist in memory until the terminal restarts. A more common performance mistake, documented across multiple MQL5 forum threads, is creating indicator handles inside OnTick() instead of OnInit(). This forces MetaTrader to create a new indicator instance on every tick, rapidly consuming memory and CPU. Handles should be created once in OnInit() and reused throughout the EA’s lifetime.
Practical sizing from indicator analysis
For a reader trying to estimate their setup’s indicator overhead, the calculation is straightforward. Count the total indicators across all charts. Multiply by 10 MB for a rough MT4 estimate (this includes both buffer cost and the empirical overhead). A setup with 5 charts averaging 3 indicators each has 15 indicator instances, consuming roughly 150 MB of indicator overhead on MT4. The same setup on MT5 with handle sharing might consume 80 to 100 MB.
Add this to the platform baseline, chart data overhead, and Windows OS consumption from the budget section. If the total exceeds 75% of your VPS RAM, either reduce indicators, reduce max bars, or upgrade the plan. The math is deterministic. The VPS tier follows from the numbers.
VPS Sizing by Strategy Type
The following recommendations synthesize benchmark data from MQL5 developers, VPS provider production experience, and real trader configurations. Prices reflect March 2026 market rates.
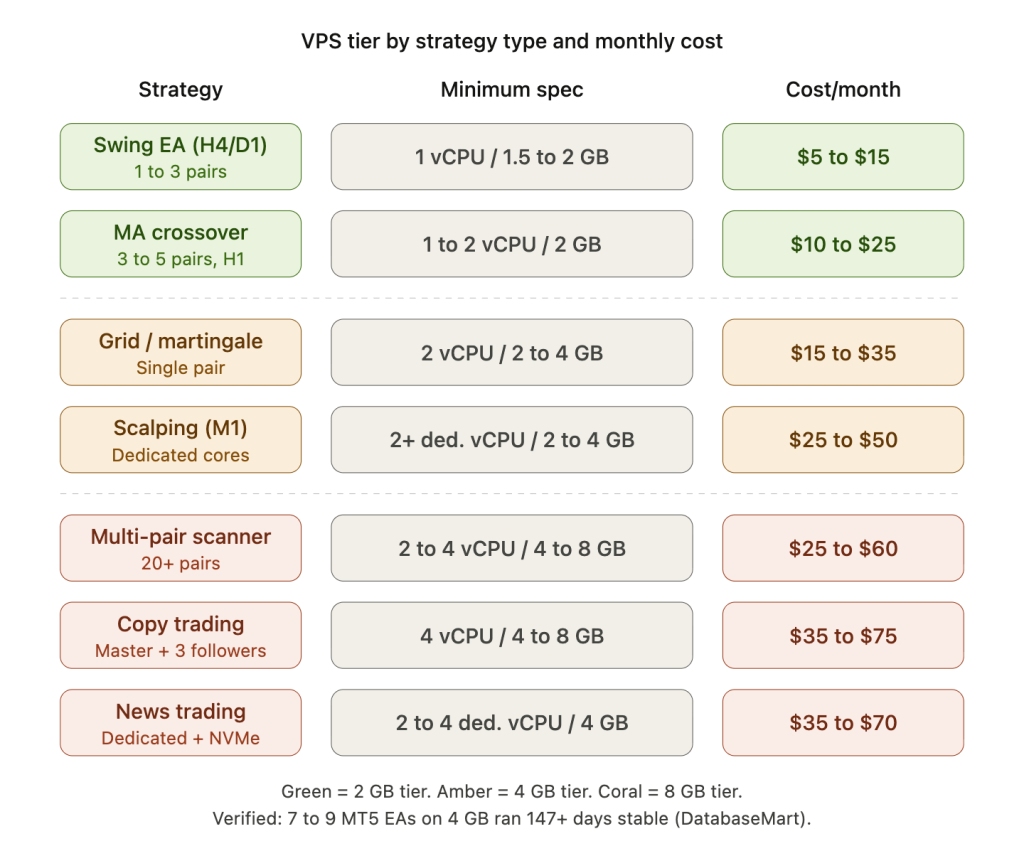
A swing EA on H4 or D1 monitoring 1 to 3 pairs is the lightest workload. Minimum specification: 1 vCPU, 1.5 to 2 GB RAM. Monthly cost: $5 to $15. Providers at this tier include Cloudzy at $7.48, FXVPS.pro at $6.90, and the MetaQuotes built-in VPS at $12.80.
An MA crossover or simple trend-following EA on 3 to 5 pairs at H1 needs marginally more headroom. Minimum specification: 1 to 2 vCPU, 2 GB RAM. Monthly cost: $10 to $25. TradingFXVPS at $25, AccuWebHosting at $7.99, and MassiveGRID from $1.99 serve this tier.
A grid bot on a single pair needs more RAM than the code complexity suggests because of position accumulation during drawdowns. Minimum specification: 2 vCPU, 2 to 4 GB RAM. Monthly cost: $15 to $35. FXVM Basic at $35 and NYC Servers at $25 are representative.
A scalping EA on M1 needs dedicated CPU cores (not shared) because tick processing must not be delayed by neighboring tenants during high-volume periods. Minimum specification: 2+ dedicated vCPU, 2 to 4 GB RAM, NVMe storage. Monthly cost: $25 to $50. TradingFXVPS at $45 and FXVM Advanced at $50 fit this profile.
A multi-pair scanner monitoring 20+ pairs crosses into the 4 to 8 GB range where chart data overhead dominates. Minimum specification: 2 to 4 vCPU, 4 to 8 GB RAM. Monthly cost: $25 to $60. ForexVPS.net Edge at $55 and MassiveGRID Trader tier serve this workload.
Copy trading with a master plus 3 followers requires four terminal instances plus copier software. Minimum specification: 4 vCPU, 4 to 8 GB RAM. Monthly cost: $35 to $75. ForexVPS.net Prime at $75 and TradingFXVPS Expert at $90 accommodate this.
A news trading EA needs dedicated cores and NVMe for the reasons covered in our infrastructure guide to news events. Minimum specification: 2 to 4 dedicated vCPU, 4 GB RAM, NVMe. Monthly cost: $35 to $70. FXVM High Frequency at $69 and TradingFXVPS HFT at $75+ target this specifically.
Backtesting and optimization should never run on a live trading VPS. Minimum specification: 8 to 16 vCPU, 16 to 32 GB RAM. Monthly cost: $100 to $400 on dedicated servers only.
MetaQuotes’ built-in VPS deserves separate consideration. It offers up to 3 GB RAM, several physical cores, and 16 GB disk for $12.80 to $15/month with sub-3ms latency to 70% of brokers. The terminal runs with graphics completely disabled, which is an efficiency advantage. The limitations are firm: no upgrades beyond 3 GB, no DLL calls (which breaks many custom EAs and indicators), no RDP access for monitoring or debugging, and one trading account per subscription. For a trader running a single simple EA without DLL dependencies, it is the most cost-effective option available. For anything involving multiple accounts, custom DLLs, or the need for Windows-level monitoring and control, a full VPS is necessary.
When to optimize versus when to upgrade
The cost difference between VPS tiers is modest relative to most trading account sizes. A 2 GB VPS runs $8 to $25/month. A 4 GB VPS costs $25 to $50/month. An 8 GB plan is $50 to $100/month. The incremental $15 to $25/month to double RAM is roughly the cost of a single pip of slippage on a standard lot.
Running too close to resource limits creates costs that exceed the VPS savings. When RAM reaches capacity, Windows pages to disk. MetaTrader becomes sluggish even if network latency is low. During high-volatility events when tick volume spikes 5 to 10x, every EA on the physical host activates simultaneously. If RAM or CPU is already at 80%+ utilization during calm markets, this is precisely when execution degrades, and precisely when execution quality matters most.
The practical rule: exhaust the free optimizations first. Reduce max bars in chart to 10,000. Clean Market Watch to traded pairs only. Disable unnecessary MT5 community features. Set High Performance power plan. Add Defender exclusions. These changes collectively reduce resource consumption by 50 to 70% in many configurations and cost nothing. If the setup still runs above 75% RAM utilization after these optimizations, upgrade. The $15 to $25/month incremental cost is almost always cheaper than the execution degradation of running at capacity during the moments that determine profitability.
Monitor resource usage at the 12 to 24 hour mark, not at startup. MetaTrader’s memory consumption grows over time as tick history accumulates, log buffers expand, and cached timeseries persist. A setup that shows 60% RAM usage at launch may reach 80% by midweek. The 25% free RAM rule and 80% maximum sustained CPU guideline should be evaluated against the steady-state figures, not the fresh-restart figures.
FAQ
My EA runs fine on my home PC with 16 GB RAM. Why would it struggle on a 2 GB VPS?
Because your home PC has 14 to 15 GB available for MetaTrader after the OS loads. A 2 GB VPS has 800 MB to 1.2 GB available after Windows Server takes its share. The EA itself may be lightweight, but MetaTrader’s baseline consumption, chart data, and indicator buffers all compete for that constrained space. A setup that uses 1.5 GB total on your home PC (invisible against 16 GB) exceeds the available RAM on a 2 GB VPS after OS overhead. Check your home PC’s Task Manager for the actual memory consumption of terminal.exe. If it exceeds 800 MB, a 2 GB VPS will not work without optimization.
Can I run two MT4 terminals on a 2 GB VPS?
It depends on the configuration, but in most cases it is tight to the point of being risky. Two bare MT4 terminals consume 300 to 400 MB. Add 3 charts each with a few indicators and you reach 600 to 900 MB for trading applications alone. With Windows Server taking 800 MB to 1.2 GB, total consumption hits 1.4 to 2.1 GB, leaving zero to negative headroom. Real traders have documented running multiple terminals on 1 to 2 GB, but these configurations leave no buffer for memory growth or volatility spikes. A 4 GB plan provides the headroom that makes two terminals reliable rather than fragile.
Does the EA’s code complexity affect memory much?
Far less than most traders assume. A complex neural network EA and a simple MA crossover EA differ by perhaps 5 to 20 MB of code memory. The dominant factors are chart data (controlled by max bars and chart count), indicator buffers (controlled by indicator count and buffer depth), and terminal instances (one per broker account). An EA with 5,000 lines of MQL code does not consume meaningfully more RAM than one with 500 lines. The environment the EA runs in matters more than the EA itself.
Should I choose MT4 or MT5 for a resource-constrained VPS?
MT4 uses less RAM per instance. Budget approximately 512 MB to 1 GB per MT4 terminal versus 768 MB to 1.5 GB per MT5 terminal for a moderately loaded setup. On a 2 GB VPS, this difference determines whether you have comfortable headroom or none. MT4 is the better choice when the priority is fitting maximum terminals into minimum RAM. MT5 earns its higher baseline when your strategy needs features that MT4 cannot provide: multi-core optimization, OrderSendAsync() for non-blocking execution, indicator handle sharing across EAs, or the 64-bit memory space for strategies that exceed MT4’s 2 GB per-process ceiling. If neither of those applies, MT4 delivers the same trading result at lower infrastructure cost.
How do I measure my actual resource usage on the VPS?
On MT4, use Windows Task Manager (Ctrl+Shift+Esc). Look at the “Private Working Set” column for each terminal.exe process. On MT5, press F2 to open the built-in Task Manager, which shows per-EA memory and CPU, per-symbol thread statistics, and context switches. Measure at the 12 to 24 hour mark after continuous operation, not immediately after startup. MetaTrader accumulates tick history and cached data over time, so fresh-restart figures understate real consumption by 20 to 40%. The steady-state measurement is what your VPS must sustain through the trading week.
Is the MetaQuotes VPS enough for my EA?
If your EA meets three conditions, the MetaQuotes VPS at $12.80 to $15/month is likely the most cost-effective option: the EA runs without DLL dependencies (no custom DLL calls in the code or indicators), you need only one trading account, and the total setup fits within 3 GB RAM. The service provides sub-3ms latency to 70% of broker servers and runs a stripped-down terminal with graphics disabled, which is an efficiency advantage. If your EA uses DLLs, if you need multiple accounts, or if you need Windows-level access for monitoring scripts and log management, a full VPS is necessary regardless of the resource footprint.
References
- MQL5.com Documentation. “Decreasing Memory Consumption by Auxiliary Indicators”: indicator buffer formula (buffers x max_bars x 8 bytes). Maximum 512 indicator buffers per custom indicator. CopyTicks() terminal cache. OrderSendAsync() benchmarks (78 to 125ms for 10 orders vs 1,000 to 9,000ms synchronous). HistorySelect() performance degradation at thousands of orders. HistorySelectByPosition() as targeted alternative.
- MQL5.com Forum. Fatkhullin, R. (MetaQuotes CEO): MT5 design philosophy, “use the available memory, rather than trying to shrink to 100-200 MB,” targeting 4 to 64 GB systems. Developer measurements: MT4 terminal at 110 MB with 2 charts and 1 EA at 1 to 2% CPU. MT4 instances as low as 30 to 100 MB with aggressive optimization. Indicator overhead empirically confirmed at approximately 10 MB per indicator per chart. 10 charts with 3 iStdDevOnArray indicators adding 300 MB. OnTimer() recommendation for multi-currency EAs. “Max bars in chart” versus “Max bars in history” clarification. MT4 indicator data duplication per chart. Strategy Tester agent memory: ~459 MB per agent (iMA/1 month), ~1.78 GB per agent (1 year EURUSD M5). MetaQuotes guidance on physical versus logical core count for optimization. Self-optimizing AI EA consuming 809 MB on MQL5 VPS. iSpy multi-pair scanner failing on 3 GB MQL5 VPS.
- ForexFactory Forum. RAM measurements: 23 M1 pairs at 500,000 bars consuming ~1 GB, reduced to 5,000 bars = ~25 MB. Trader running 2 live plus 4 demo accounts on Kimsufi Celeron 1.2 GHz / 2 GB RAM for two years. Problem indicators identified (Butterworth filters, Schaff Trend Cycle). Trader running 7 MT4 terminals on 1 GB VPS. Trader running 2 live plus 5 demo instances on 512 MB.
- ForexSB Forum. 80 strategies consolidated into single portfolio EA using OnTimer() at 10-second intervals with “minimal CPU overhead” on a single chart.
- VPS Provider Production Data. MassiveGRID: MT4 idle 150 to 200 MB, per-chart 30 to 50 MB (MT4) and 40 to 70 MB (MT5), MT5 instances 768 MB to 1.5 GB. 4 to 8 GB recommended for copy trading. Windows optimization recommendations (High Performance power plan, Defender exclusions, service disabling, processor scheduling). FXVPS.biz: per-chart 50 to 100 MB at 500,000 bars, Market Watch cleanup reducing CPU 20 to 40%. WinnerVPS: M1 charts up to 300 MB each. NYC Servers: 5-pair grid EA “2 GB minimum, 4 GB gives breathing room.” Hyonix: 5,000 bars minimum viable setting.
- DatabaseMart. Published production benchmark: 7 to 9 MT5 EA instances on 2 vCPU / 4 GB RAM, averaging 7 to 15% CPU with peaks at 50 to 60%, memory at 45 to 60%, running 147+ consecutive days without crashes.
- MetaQuotes Built-in VPS Service. Up to 3 GB RAM, 16 GB disk, several physical cores, $12.80 to $15/month. Sub-3ms latency to 70% of broker servers. Graphics completely disabled. No DLL support, no RDP access, no Strategy Tester, one account per subscription.
- VPS Provider Pricing (March 2026). Cloudzy $7.48/2 GB, FXVPS.pro $6.90, AccuWebHosting $7.99, MassiveGRID from $1.99, TradingFXVPS $25/$45/$90, FXVM $35/$50/$69, NYC Servers $25, ForexVPS.net $55/$75. Pricing verified at time of research; subject to change.
Editorial Note
This article maps trading strategy types to VPS resource requirements using documented benchmarks and real trader configurations. It does not constitute financial advice, trading strategy recommendations, or endorsement of any specific EA, broker, or VPS provider.
Resource consumption figures are based on measurements from MQL5 developer forums, VPS provider production data, and community benchmarks. Actual consumption varies by broker data feed characteristics, EA code efficiency, indicator implementation, chart configuration, and MetaTrader platform version. The figures should be treated as reference ranges for sizing decisions, not guaranteed specifications.
The indicator buffer formula (buffers x max_bars x 8 bytes) is documented by MetaQuotes in official MQL5 articles. The empirical overhead of approximately 10 MB per indicator per chart beyond the buffer formula was measured by individual developers and may vary by MT4/MT5 version and configuration. MT5’s indicator handle sharing reduces duplication but does not eliminate all per-chart overhead.
VPS provider pricing is current as of March 2026 and subject to change. Provider specifications (RAM, CPU, storage, network) should be confirmed at time of purchase. The MetaQuotes VPS limitations (3 GB maximum, no DLL, no RDP, single account) are documented on the MQL5.com VPS page and may change in future platform updates.
The DatabaseMart benchmark (147+ days, 7 to 9 EA instances on 4 GB) is the only independently published long-running production test identified during research. Other sizing recommendations aggregate multiple provider guidelines and community reports. Traders should validate resource requirements on their specific configuration using the monitoring methods described in this article before committing to a VPS tier for live trading.