
An RSI divergence on H4 forms across 5 to 20 candles. That spans 20 to 80 hours of market activity, potentially four trading days of continuous formation. The actionable signal fires on exactly one candle: the bar where the divergence confirms. If your scanner is offline when that bar closes, the setup is gone. By the time you check your charts the next morning, price may have already moved 50 to 100 pips from the entry level, eliminating the risk-reward profile that made the setup worth trading.
This makes RSI divergence detection one of the strongest always-on use cases for a Forex VPS. Unlike candlestick pattern detection (which checks individual bars) or trend-following indicators (which produce gradual signals), divergence scanning requires the scanner to survive the entire multi-candle formation period, across every session, without interruption. A home PC running 16 hours per day misses 33% of all forex sessions. A VPS running at 99.99% uptime misses 52.6 minutes per year.
This article covers how multi-pair divergence scanner EAs work architecturally (dashboard versus per-chart, and why the difference matters for VPS resources), the specific memory consumption model for a 28-pair scanner with indicator buffer calculations verified against MQL5 documentation, why the SendNotification() rate limit of 10 per minute becomes the binding constraint for multi-pair scanners and how to route around it, and what VPS tier each scanner configuration requires. Resource figures draw from MQL5 marketplace product data, forum benchmarks, official MetaQuotes documentation on indicator handles and buffer allocation, and VPS provider operational guides. Where figures come from single or commercially interested sources, that context is noted.
How multi-pair divergence scanners work
Two architectures exist for scanning RSI divergences across multiple pairs, and the choice between them determines VPS resource consumption more than any other decision.
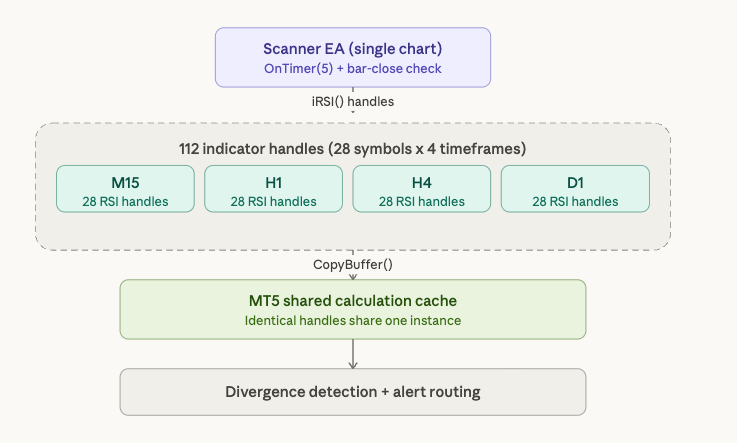
The dashboard approach runs a single EA on one chart. That EA calls iRSI() with explicit symbol and timeframe parameters for every target pair. In MT5, each call returns an integer handle created during OnInit(). For 28 symbols across 4 timeframes (M15, H1, H4, D1), this creates 112 indicator handles. The EA retrieves calculated values via CopyBuffer() during execution, pulling data into local arrays rather than creating chart-displayed buffers. The entire scanner operates from one chart window. In MT4, the simpler iRSI() function returns values directly without a handle system, but each call may trigger history download if the data is not already cached, producing error codes 4066 and 4073 that the EA must handle gracefully.
The per-chart approach attaches a scanner indicator to each of 28 separate charts. Each indicator instance independently calculates RSI and performs divergence detection for its own symbol. This is simpler to code but consumes substantially more memory because each chart carries its own OHLC data overhead (60 bytes per bar via the MqlRates structure) plus terminal rendering overhead, even when no human watches the screen. The memory comparison is covered in detail in the indicator buffer math section below.
MT5 provides a specific efficiency advantage for the dashboard architecture. Official MQL5 documentation confirms that indicator calculations are shared globally: if a copy of an indicator with identical parameters already exists, no new copy is created and the reference counter for the existing copy increments. This means if the scanner EA and a separate trading EA both request iRSI(14) on EURUSD H1, MT5 maintains one shared calculation. MT4 does not share calculations. Each iRSI() call from different indicators or EAs creates independent computations, duplicating both memory and CPU work. For multi-pair scanner deployments, this shared cache is a meaningful resource savings that compounds across 112 handles.
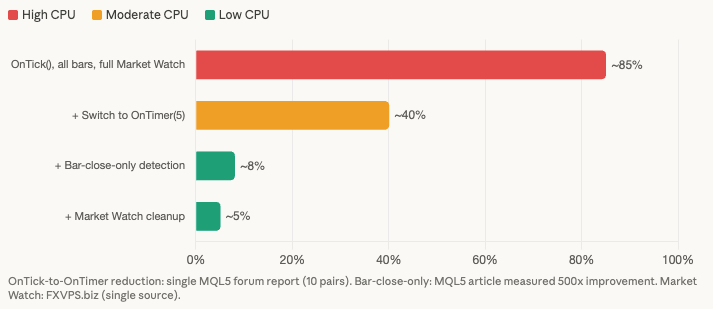
The trigger mechanism determines CPU consumption. When an EA sits on a single chart, OnTick() fires only for that chart’s symbol. For a dashboard scanner monitoring 28 pairs, relying on OnTick() means the scanner recalculates only when the host symbol ticks, missing timely detection on other pairs. Developers solve this with OnTimer() at 1 to 5 second intervals. One forum user measured the impact directly: switching from tick-based to timer-based scanning reduced CPU usage from 80 to 90% down to 30 to 50% for 10 pairs on a single chart. This is a single forum report and has not been independently replicated, but the directional finding is consistent with expected behavior because timer-based polling eliminates redundant processing between meaningful price changes.
The deepest optimization exploits a fundamental property of divergence detection: only completed bars matter. A divergence pattern forms on closed candles. Partial bars are irrelevant because the swing high or low is not confirmed until the bar closes. Checking only on new bar formation (comparing the current bar’s time to a stored previous value) reduces per-tick processing to one calculation per bar per symbol. On M15 with 28 pairs, this means 28 calculations every 15 minutes instead of thousands per minute. An official MQL5 article measured the performance difference between optimized and non-optimized indicator code at over 500x. Combined with OnTimer() polling, bar-close-only detection makes even a 112-handle scanner lightweight between bar closes.
What the MQL5 marketplace offers
The MQL5 marketplace has a mature ecosystem of RSI divergence scanning tools, but no product documents VPS resource requirements and no product offers native Telegram integration. Evaluating these tools through an infrastructure lens reveals which ones are best suited for always-on VPS deployment.
The most feature-rich option is Amir Atif’s RSI Divergence Scanner, available for both MT4 ($60) and MT5 ($60), both rated 5.0 stars. The MT4 version handles 70 symbols across 9 timeframes, and the developer claims smooth operation “on an average PC.” The MT5 version handles 50 symbols across 21 timeframes, reflecting MT5’s higher per-symbol overhead with its additional timeframe set. Features include built-in support and resistance zone filtering, 6 to 7 confirmation types (candlestick patterns, RSI line crossing 50, Heiken Ashi color change), and click-to-open-chart functionality. Alerts fire via popup, push notification, and email. The scanner updates every 1-minute candle open and requires a minimum of 300 candles per chart. The “70 symbols x 9 timeframes” claim is vendor marketing, not independently benchmarked, but it is internally consistent with the MT5 version’s lower symbol count reflecting MT5’s heavier per-symbol footprint.
The Double Divergence Scanner by Jan Flodin has the highest download count in the category: 1,536 demo downloads on MT4 and 765 on MT5, both priced at $39. It supports 12 oscillators beyond RSI, including MACD, Stochastics, CCI, Awesome Oscillator, and OBV. All Market Watch symbols can be scanned from a single chart across all timeframes from M1 to Monthly. The product can require double or triple divergence confirmation across different indicators simultaneously. For VPS integration, the most relevant feature is signal export: it writes signals to global variables or files, enabling a separate auto-trading EA to consume the scanner’s output without the scanner itself executing trades. The developer explicitly recommends placing the indicator on “a clean chart without any other indicators or EAs which could interfere,” confirming that resource isolation matters for reliable operation.
The most reviewed product is Reza Aghajanpour’s RSI Divergences Scanner, with 18 reviews on MT4 (4.42 stars, $30) and 17 reviews on MT5 (4.77 stars, $30). It uses a “Scan All Charts” button approach rather than a persistent dashboard, scanning all symbols across all timeframes on demand with a configurable re-scan timer for automatic periodic rescanning. It includes Fibonacci-based SL/TP levels and alert time scheduling. One user review highlights the VPS-relevant advantage: the scanner “finds divergences as they are forming, rather than others that signal halfway through the move.” A free tester version (limited to USDCHF and AUDCHF) allows evaluation before purchase.
A free alternative exists: Duc Hoan Nguyen’s RSI Divergence Scanner for both MT4 and MT5, rated 5.0 stars with 3 reviews each. It supports multi-currency, multi-timeframe scanning with email, push, and sound alerts. For traders testing the scanner-on-VPS concept before committing to a paid product, this is a reasonable starting point.
On the automated trading side, Quantum RSI Divergence Pro by VALU VENTURES (MT5, $30) claims 15 divergence strategies and four trading modes. It launched in July 2025 with zero reviews. Marketing language is heavy, and claims should be treated with caution until verified by independent users.
Memory consumption: the indicator buffer math
Every indicator buffer in MetaTrader stores one double-precision floating-point value (8 bytes) per bar. This is not an approximation. It is the documented size of the MQL5 double type, confirmed by MQL5 forum moderator William Roeder across thousands of posts: “Every indicator is adding 4x 200,000 per buffer. That’s ~1 MB x how many buffers x how many indicators.” The math scales linearly with bar count, making the max bars setting the single largest variable in scanner memory consumption.
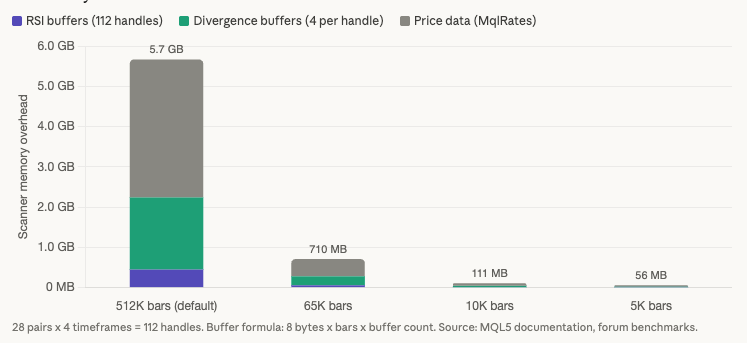
At the default max bars of 512,000, a single RSI buffer consumes approximately 3.9 MB. At 200,000 bars (the effective default for many brokers’ history depth), it consumes approximately 1.5 MB. At 10,000 bars, approximately 78 KB. At 5,000 bars, approximately 39 KB. The difference between default and optimized settings is two orders of magnitude per buffer. Multiply that across 112 indicator handles and the aggregate difference determines whether a scanner fits on a 2 GB VPS or requires 8 GB.
A standard RSI divergence scanner needs 4 to 6 indicator buffers per symbol and timeframe combination. One buffer stores RSI values (via the iRSI handle or direct calculation). Two to three buffers handle ZigZag or peak detection logic for identifying swing highs and swing lows. Two or more buffers track divergence line coordinates for bullish and bearish divergences. The scanner also needs price data: the MqlRates structure requires 60 bytes per bar (seven doubles at 8 bytes each plus 4 bytes for tick volume). In the single-chart dashboard architecture, the EA uses CopyBuffer() to pull indicator data into local arrays rather than creating chart-displayed buffers, but the memory for those arrays is still allocated.
The 28-pair, 4-timeframe scenario with 10,000 max bars breaks down as follows. The 112 RSI handles consume approximately 8.75 MB (112 handles at 78 KB each). Divergence detection buffers at 4 per symbol add approximately 35 MB (112 combinations at 4 buffers at 78 KB). Price data adds approximately 65.6 MB (112 combinations at 60 bytes per bar at 10,000 bars at roughly 600 KB each). Combined scanner overhead: approximately 110 to 150 MB on top of the MT5 base terminal consumption of 250 to 350 MB. Total terminal memory: approximately 360 to 500 MB. On a 2 GB VPS after Windows Server takes 800 MB to 1.2 GB, this fits but leaves thin headroom.
The same scenario with default max bars of 512,000 is catastrophic. RSI buffers alone consume approximately 448 MB (112 handles at 4 MB each). Divergence detection buffers add approximately 1,792 MB (112 combinations at 4 buffers at 4 MB). That exceeds 2 GB before accounting for price data, terminal overhead, or the operating system. A scanner that runs comfortably at 10,000 max bars becomes physically impossible at the default setting on any VPS under 8 GB.
One MQL5 forum user demonstrated the extreme case on a single buffer: M1 on GBPUSD with unlimited max bars allocated 6.97 million bars, consuming approximately 53 MB for one buffer. Multiply that across the 5 to 6 buffers a divergence scanner needs per symbol and the numbers become untenable within a single symbol, let alone 28.
The per-chart approach compounds the problem. Each open chart carries its own OHLC data overhead. One forum user measured 5 charts with 200,000 bars and found 180 MB of actual consumption versus 60 MB expected from raw MqlRates math. The 3x overhead comes from internal terminal structures, index arrays, and timeseries access layers that exist per chart. At 28 charts, this overhead alone consumes over 1 GB. The dashboard architecture avoids this entirely by operating from a single chart window.
For VPS deployment, the recommendation is unambiguous: set max bars to 5,000 to 10,000. For RSI divergence detection, 5,000 bars on H4 covers approximately 3 years of historical data, far more than the 5 to 20 candle lookback that divergence patterns require.
VPS tier planning for scanner workloads
The memory model from the previous section translates directly into VPS tier recommendations. Two scanner architectures produce different resource profiles, and understanding both prevents overbuying or underprovisioning.
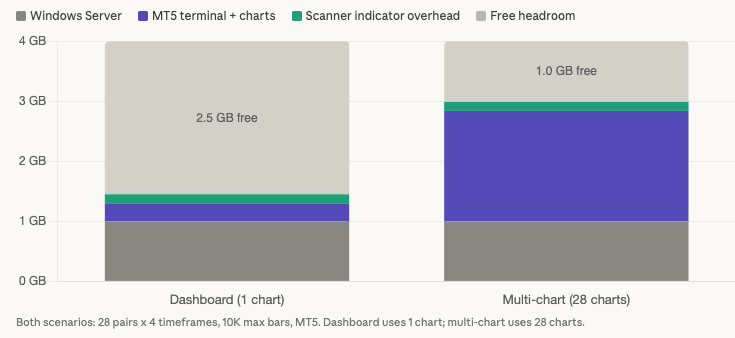
A dashboard scanner running from a single chart on MT5 with 28 pairs across 4 timeframes and 10,000 max bars consumes approximately 1,400 to 1,500 MB total: Windows Server at 800 MB to 1.2 GB, MT5 base terminal with one chart at roughly 300 MB, and scanner indicator overhead at 110 to 150 MB. The same workload deployed as 28 separate charts with per-chart indicators consumes approximately 2,300 to 2,840 MB, because each chart carries its own OHLC data, rendering overhead, and internal terminal structures. The dashboard approach saves 900 MB to 1,300 MB. On a constrained VPS, that difference determines whether the scanner fits at all.
On a 2 GB VPS, the dashboard scanner is feasible but tight. After Windows and the scanner terminal, approximately 500 to 600 MB of headroom remains. There is no room for a second terminal, a trading EA on a separate instance, or any meaningful buffer for memory growth during continuous operation. Reducing max bars from 10,000 to 5,000 reclaims approximately 50 to 75 MB of the scanner overhead, providing slightly more breathing room. The multi-chart approach does not fit at 2 GB under any configuration.
A 4 GB VPS is the recommended tier for traders running a divergence scanner alongside a live trading setup. The dashboard scanner consumes approximately 1,450 MB. A separate trading terminal with a few charts and simple EAs adds 400 to 600 MB. Total consumption sits around 1,850 to 2,050 MB, leaving roughly 2 GB of headroom for memory growth over the trading week, tick volume spikes during news events, and the 25% free RAM buffer that prevents swap thrashing. This tier also accommodates increasing max bars to 50,000 for deeper divergence lookback on daily and weekly timeframes, though the default 10,000 is sufficient for most divergence patterns.
An 8 GB VPS supports power configurations: multiple scanner instances across different oscillators (the Double Divergence Scanner can monitor MACD, Stochastics, and CCI simultaneously alongside RSI), MT4 and MT5 terminals running in parallel, or heavy multi-timeframe scanning across all 21 MT5 timeframes. After the scanner terminal, a trading terminal, and Windows overhead, approximately 4,700 to 5,500 MB remains. This headroom accommodates weeks of continuous operation without restart pressure.
CPU planning is often more important than RAM planning for scanner workloads, and the community evidence on this point is consistent. Multiple users on MQL5 forums and Myfxbook reported slowdowns on 6 to 14 GB VPS plans with shared CPU. One user stated that “purchasing more RAM didn’t solve it,” and the problem disappeared only after switching to dedicated CPU cores. For a dashboard scanner using OnTimer() polling with bar-close-only detection, 1 vCPU is sufficient on MT4 (which is single-threaded regardless of core count). MT5 scanners benefit from 2 vCPU because indicator calculations across different symbols parallelize across cores. For setups combining a scanner terminal with a separate live trading terminal, 2 vCPU is the minimum to prevent the scanner’s processing bursts from delaying order execution in the trading terminal.
The strongest configuration for most traders separates scanner and trading workloads into two terminal instances on the same VPS. The scanner terminal runs in portable mode with aggressive optimization: minimal max bars, cleaned Market Watch, OnTimer() polling, no chart rendering. The trading terminal runs lean with only traded symbols and tick-by-tick processing for execution speed. Both share the operating system overhead (paid once, not twice), making a single 4 GB VPS more cost-effective than two separate 2 GB instances.
Alert architecture for 28-pair scanners
A 28-pair scanner across 4 timeframes monitors 112 symbol and timeframe combinations. When multiple divergences confirm in the same session, which happens regularly during correlated moves across EUR or JPY crosses, the alert delivery system becomes the bottleneck rather than the detection logic. The constraints are specific and documented.
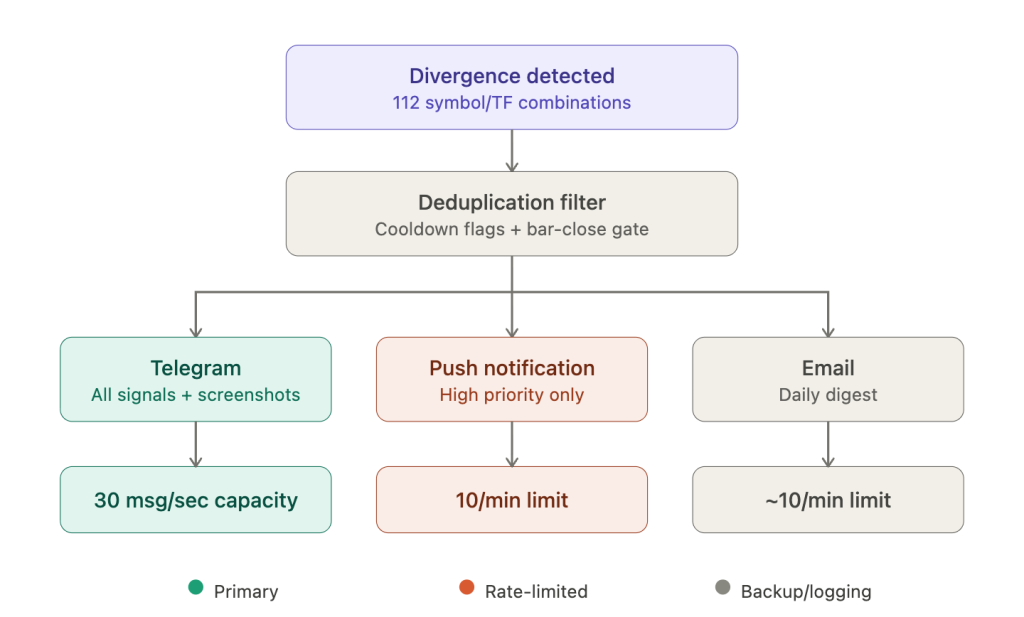
SendNotification() has a hard rate limit of 2 calls per second and 10 calls per minute. If the EA exceeds this, MetaQuotes’ dynamic monitoring can permanently disable the function for that account, returning error code 4518 (ERR_NOTIFICATION_TOO_FREQUENT). This is not a soft throttle that resets. For a 112-combination scanner where 5 to 8 divergences might confirm within the same minute during a broad USD move, 10 notifications per minute is a binding constraint. Each message is capped at 255 characters, further limiting what a single notification can convey about the divergence (symbol, timeframe, direction, RSI values, price levels).
Telegram via WebRequest() to the Bot API has vastly superior throughput: 30 messages per second to different chats and 1 message per second to the same chat. Messages support up to 4,096 characters, enough to include the full divergence context (symbol, timeframe, RSI values at both swing points, price levels at both swing points, divergence type, and confirmation status) in a single message. Telegram also supports chart screenshot delivery: ChartScreenShot() saves the chart as PNG, and the EA reads the file and sends it via the sendPhoto API endpoint. A free library on MQL5 Code Base (“MT5 to Telegram” by StepanSinic) provides message queuing, multi-channel support, screenshot sending, and retry mechanisms. WebRequest() is synchronous and blocks the EA thread until the response arrives, but a localhost Flask relay (as covered in our AI tools integration guide) eliminates this concern by handling the Telegram API call asynchronously.
The configuration requirement is manual and per-installation: add https://api.telegram.org to the URL whitelist in Tools, then Options, then Expert Advisors. This cannot be set programmatically and must be configured on each VPS terminal instance individually. Some VPS networks block Telegram. If the connection fails, verify DNS resolution and outbound HTTPS on port 443 to api.telegram.org.
Email via SendMail() is best reserved for periodic summary digests rather than per-signal alerts. It shares approximate rate limits with push notifications (roughly 10 per minute) and supports only plain text with no attachments. Gmail requires App Passwords since Google discontinued “Less Secure Apps” in 2022, and some VPS providers block outgoing SMTP ports. GMX (mail.gmx.com on port 587) is the most commonly recommended alternative in the VPS trading community, with a reported limit of 26 emails per hour.
The recommended multi-tier routing for a 28-pair scanner: Telegram as the primary channel for all detected divergences, with full context and optional chart screenshots. Push notifications reserved exclusively for highest-priority confirmed signals, staying well within the 10-per-minute ceiling. Email as a backup channel sending daily or session-end summary digests consolidating all detected divergences and their outcomes.
Alert deduplication prevents notification fatigue. Community code patterns include per-symbol and per-timeframe cooldown flags (a boolean array tracking whether an alert has already fired for a specific combination), new-bar-detection gating (alerting only on completed bars, which naturally limits frequency), aggregated batch messages (combining multiple divergences into a single notification within the character limit), and a Sleep(6000) call (6 seconds in milliseconds) after each SendNotification() to enforce rate limit compliance programmatically. Sound alerts via PlaySound() and popup alerts via Alert() are irrelevant on a headless VPS. No audio device is present, sounds are silently discarded, and popup dialogs accumulate in the background consuming memory. Disable both for VPS deployments.
Why 24/7 operation matters specifically for divergence detection
Every scanner type benefits from continuous operation, but divergence detection has the longest exposure window of any scanning workload in this article series. A candlestick pattern forms on a single bar. A chart pattern like a head-and-shoulders might develop over 10 to 30 bars. An RSI divergence on H4 forms across 5 to 20 bars spanning 20 to 80 hours, and on D1 the formation extends across 1 to 4 weeks. The scanner must be running for the entire formation period because the signal has zero value until the completion candle closes. There is no partial credit for detecting 90% of a divergence.
The current article on the site includes a EUR/USD case study that illustrates this precisely. A bullish RSI divergence formed between April 22 and April 26 on the 4-hour chart. That is four trading days of continuous formation. The confirmation candle closed during a specific session. A trader monitoring only during New York hours could have missed a completion that occurred during the Asian or London session. The divergence was visible only to someone (or something) watching the chart at that exact moment.
Session coverage across 28 pairs compounds the exposure requirement. JPY crosses are most active during Tokyo. EUR and GBP pairs produce their sharpest moves during London. USD pairs dominate during New York. A 28-pair scanner running 24 hours captures divergences across all sessions. A scanner running 8 to 12 hours during the trader’s waking hours systematically misses setups in the pairs that are most liquid during off-hours. The missed signals are not random. They are concentrated in the sessions the trader does not cover, creating a systematic blind spot.
The reliability gap between a home PC and a VPS is documented in the cross-article data: 99.99% VPS uptime equals 52.6 minutes of downtime per year. Home PC compounded availability runs 90 to 97%, translating to 263 to 876 hours of downtime per year. For a divergence scanner monitoring patterns that take days to form, even brief outages create unrecoverable gaps. A home PC that reboots for Windows updates at 2:00 AM or loses internet during a thunderstorm may miss the exact completion candle of a divergence that took three days to develop. That is not a theoretical risk. It is the normal behavior of consumer hardware running a workload that demands server-grade uptime.
Weekend restarts require specific timing. The forex market opens Sunday at approximately 5:00 PM Eastern time with the early Asian session. Scanners must be operational before this open to capture the first candle’s data and resume divergence monitoring from where Friday’s close left off. A VPS configured with Autologon, a delayed startup batch script, and portable mode (as covered in our MT4 VPS optimization guide) handles Sunday open autonomously. The trader verifies scanner operation Friday evening after weekly maintenance and lets the auto-start chain manage the rest.
Scanner-specific VPS optimization
The general MT4/MT5 VPS optimizations covered in our MT4 optimization guide apply to scanner deployments, but scanner workloads have specific characteristics that make some optimizations disproportionately impactful and introduce concerns that standard trading setups do not face.
Reducing max bars is the highest-impact optimization for any scanner workload, and the indicator buffer math section above quantified exactly why. The 28-pair, 4-timeframe scanner consumes approximately 110 to 150 MB of indicator overhead at 10,000 max bars. At the default 512,000, the same scanner consumes over 2 GB in buffers alone. For RSI divergence detection, 5,000 bars on H4 covers roughly 3 years of price history. Divergence patterns span 5 to 20 candles. The remaining 4,980 bars of lookback serve no purpose on a VPS and should be eliminated.
Cleaning the Market Watch to only scanned symbols is the second priority. MetaTrader processes tick data for every visible symbol regardless of whether any chart or EA references it. FXVPS.biz reports that reducing to 5 to 10 traded pairs can cut CPU usage by 20 to 40%. This specific figure comes from a single commercially interested source, but the underlying mechanism is well-documented in official MetaTrader documentation, which recommends hiding unused securities to minimize traffic. For a scanner monitoring exactly 28 pairs, the Market Watch should contain exactly those 28 pairs and nothing else.
Switching from OnTick() to OnTimer() polling is the highest-impact CPU optimization. The forum-measured reduction from 80 to 90% CPU down to 30 to 50% was for 10 pairs on a single chart. For 28 pairs, the savings are proportionally larger because each unnecessary tick event triggers evaluation logic across more symbol handles. A 5-second timer interval catches every M1 bar close with margin and every higher timeframe bar close with certainty.
Implementing bar-close-only detection logic inside the OnTimer() callback adds a second layer of efficiency. The check is a single comparison: if the current bar time for a given symbol and timeframe equals the stored previous bar time, skip processing. This reduces 28 calculations every 5 seconds to 28 calculations only when a new bar actually opens on at least one monitored timeframe.
Disabling chart rendering on the scanner terminal eliminates GPU and CPU overhead that serves no purpose when no human watches the screen. In chart properties, disable the grid, volumes, bid and ask lines, OHLC display, and chart shift. Set the chart background to a single color. Minimize all chart windows. For the dashboard architecture running from a single chart, this overhead is already minimal, but it compounds in the per-chart approach across 28 windows.
Running the scanner terminal in portable mode (terminal64.exe /portable) isolates its data directory from the trading terminal. This allows independent max bars, Market Watch, and chart template configurations optimized specifically for scanning, without affecting the trading terminal’s setup on the same VPS.
Log file management deserves specific attention for alert-heavy scanners. A scanner generating hundreds of log entries per day accumulates large files over weeks of continuous operation. One MQL5 forum user traced progressive memory growth to excessive error logging where the terminal’s memory expanded continuously as the log file grew. Minimize Print() statements in production scanner code, and schedule weekly cleanup of the Logs directory alongside the weekly terminal restart.
FAQ
Can I run a divergence scanner on the MetaQuotes built-in VPS?
The MetaQuotes VPS ($12.80 to $15 per month) caps at 3 GB RAM with no upgrade path. A dashboard scanner with 28 pairs across 4 timeframes at 10,000 max bars consumes approximately 1,450 MB total. The MetaQuotes VPS allocates roughly 1.5 to 2 GB to the terminal after its own overhead, so a single optimized scanner fits. The limitations are significant: no DLL support (which breaks some Telegram libraries), no RDP access for troubleshooting, a maximum of 16 charts on the free tier or 32 on paid, one trading account per subscription, and users frequently report “high memory usage” warnings with multi-EA setups. One user’s EA consumed 2.7 GB in 24 hours. If the scanner is your only workload and it does not require DLL-based Telegram integration, the MetaQuotes VPS can work. For scanner plus trading terminal, or for scanners needing Telegram alerts, a full Windows VPS is required.
How many false signals should I expect from RSI divergence scanners?
ForexFactory community observations suggest roughly 3 to 4 false divergences form before a genuine reversal signal. This is not a product defect. It reflects the fundamental nature of RSI divergence as an indicator: divergence can persist and deepen through multiple swings before price actually reverses, or price can continue trending without ever reversing at all. For VPS deployment, the implication is practical: the alert system must handle frequent notifications without overwhelming the trader. The multi-tier alert routing covered in the alert architecture section (Telegram for all signals, push only for confirmed high-priority setups) is designed specifically for this signal-to-noise ratio. Alert deduplication and confirmation filtering are not optional enhancements. They are necessary for any scanner running across 28 pairs.
Can I use the same terminal for scanning and live trading?
You can, but resource contention occurs during exactly the moments that matter most. High-volatility events trigger the most scanner activity (processing tick surges across all 28 pairs) and the most trading EA activity (detecting entries, sending orders) simultaneously. On MT4, this is particularly acute because all processing is single-threaded. A heavy scanner calculation blocks the trading EA’s OrderSend() until it completes. The recommended approach is two separate terminal instances on the same VPS: one optimized for scanning breadth (many symbols, minimal max bars, timer-based polling) and one optimized for execution speed (few charts, minimal indicators, tick-by-tick processing). On a 4 GB VPS, both fit comfortably with the dashboard scanner architecture.
Does MT5’s indicator sharing actually reduce memory for scanners?
Yes, but the benefit is realized only when multiple EAs or indicators request identical indicator calculations. If your scanner EA creates iRSI(14) handles for EURUSD H1 and a separate trading EA also uses RSI(14) on EURUSD H1, MT5 maintains one shared calculation instance instead of two. For a standalone scanner with no other EAs referencing the same indicators, the sharing mechanism provides no savings because there is nothing to share with. The primary scanner benefit of MT5 is multi-threaded indicator calculation across symbols, not handle sharing.
What happens if my VPS reboots during a multi-day divergence formation?
The divergence pattern itself is not lost. RSI values are calculated from historical price data, and the swing points that define the divergence exist in completed bars that the broker’s history server retains. When the scanner restarts and recalculates RSI across the stored history, it will detect any divergence that is still forming or has just completed. The risk is narrow but real: if the VPS is offline during the specific bar close where the divergence confirms, the scanner misses the alert for that completion candle. By the next recalculation, the signal may be stale. With the auto-start chain (Autologon, Startup folder batch script, 60 to 120 second delay), downtime from a planned reboot is typically 3 to 5 minutes. Unplanned reboots carry more risk depending on how quickly the VPS provider restores the instance.
References
- MetaQuotes Software Corp. MQL5 Reference: iRSI() function. Handle-based indicator access in MT5 with shared calculation instances. Direct value return in MT4 without handle system. Official documentation confirms: “If a copy of the indicator with such parameters already exists, the new copy is not created, and the counter of references to the existing copy increases.”
- MetaQuotes Software Corp. MQL5 Reference: MqlRates structure definition. 60 bytes per bar (7 doubles at 8 bytes each plus 4 bytes for tick volume). Accessed March 2026.
- MetaQuotes Software Corp. MQL5 Reference: SendNotification() function. Rate limits of 2 calls per second and 10 per minute, 255-character maximum, error code 4518 (ERR_NOTIFICATION_TOO_FREQUENT). Dynamic monitoring can permanently disable the function. Accessed March 2026.
- MetaQuotes Software Corp. MQL5 Reference: WebRequest() function. Synchronous/blocking execution. URL whitelist required in Tools, then Options, then Expert Advisors. Cannot be called from indicators, only EAs and scripts.
- MetaQuotes Software Corp. MQL5 Articles: “Optimizing Indicator Calculations.” Measured optimized versus non-optimized indicator performance: “time of test processing differs by more than 500 times.”
- Amir Atif. RSI Divergence Scanner. MQL5 Market, MT4/MT5, $60 each. Rated 5.0 stars on both platforms. MT4 version handles 70 symbols across 9 timeframes, MT5 version handles 50 symbols across 21 timeframes. Updates every 1-minute candle open, minimum 300 candles required. Performance claim is vendor marketing, not independently benchmarked.
- Flodin, J. Double Divergence Scanner. MQL5 Market, MT4 ($39, 1,536 demo downloads, 4.0 stars) and MT5 ($39, 765 demo downloads, 4.71 stars). Supports 12 oscillators. Writes signals to global variables and files for EA integration. Developer recommends placement on “a clean chart without any other indicators or EAs.”
- Aghajanpour, R. RSI Divergences Scanner. MQL5 Market, MT4 ($30, 18 reviews, 4.42 stars) and MT5 ($30, 17 reviews, 4.77 stars). Scan-all-charts button approach with configurable re-scan timer. User review: “Finds divergences as they are forming, rather than others that signal halfway through the move.”
- Nguyen, D.H. RSI Divergence Scanner. MQL5 Market, free, MT4 and MT5, rated 5.0 stars (3 reviews each). Multi-currency, multi-timeframe scanning with push, email, and sound alerts.
- Sinic, S. “MT5 to Telegram” library. MQL5 Code Base. Message queuing, multi-channel support, chart screenshot delivery via sendPhoto endpoint, retry mechanisms with exponential backoff.
- MQL5 Forum. William Roeder (32,000+ posts): indicator buffer memory formula. “Every indicator is adding 4x 200,000 per buffer. That’s ~1 MB x how many buffers x how many indicators.” Confirmed at 200,000 bars per buffer.
- MQL5 Forum. User measurement: 6.97 million M1 bars on GBPUSD allocated 53 MB for a single indicator buffer. Demonstrates the extreme case of unlimited max bars on low timeframes.
- MQL5 Forum. User measurement: 5 charts with 200,000 bars consumed 180 MB versus 60 MB expected from raw MqlRates calculation. The 3x overhead attributed to internal terminal structures, index arrays, and timeseries access layers.
- MQL5 Forum. OnTimer() CPU reduction from 80 to 90% down to 30 to 50% for 10-pair scanner on single chart. Single forum report, not independently replicated. Directionally consistent with expected behavior.
- MQL5 Forum. MT4 threading confirmation: “MT4 is a SINGLE Thread application, everything inside it runs Sequentially.” Verified across multiple developer posts.
- ForexFactory Forum. Max bars reduction benchmark: 500,000 to 5,000 across 23 M1 pairs reduced memory from approximately 1 GB to 25 MB (40x reduction). Single user measurement, consistent with buffer memory calculations.
- ForexFactory Forum. RSI divergence false signal frequency: approximately 3 to 4 false divergences observed before a genuine reversal signal. Community observation, not quantitatively validated across a controlled sample.
- FXVPS.biz. Market Watch cleanup yielding 20 to 40% CPU reduction. Single commercially interested source, not independently verified. Underlying mechanism (eliminating tick processing for unused symbols) is documented in official MetaTrader documentation.
- WinnerVPS. MT4 memory growth observation: “true memory consumption only becomes visible 12 to 24 hours after MT4 starts running.” Commercially interested source, consistent with independent community reports of gradual memory growth.
- Myfxbook Forum. Multiple users reported VPS slowdowns on 6 to 14 GB plans with shared CPU despite adequate RAM. User statement: “purchasing more RAM didn’t solve it.” Dedicated CPU cores resolved the issue. Consistent across multiple independent reports.
- AccuWebHosting. Scanner deployment guidance: terminal should be operational before Sunday market open (~5:00 PM ET) to capture first candle data. Commercially interested source.
Editorial Note
This article covers the deployment and resource planning of RSI divergence scanner EAs on VPS infrastructure. It does not constitute financial advice, trading strategy guidance, or a recommendation of any specific scanner product, oscillator setting, or divergence trading approach. RSI divergence is not a reliable predictor of price reversals, and this article makes no claims about the profitability of divergence-based trading strategies.
Memory estimates throughout this guide are reference ranges for infrastructure planning, not guaranteed specifications. Actual consumption varies by scanner product, indicator buffer count, max bars setting, broker history depth, and MT4/MT5 build version. The memory model (8 bytes per bar per buffer) is mathematically derived from official MQL5 documentation and verified against community measurements, but real-world terminal overhead includes internal structures not captured by the buffer calculation alone (as demonstrated by the 3x overhead measured in forum benchmarks).
VPS provider figures cited in this guide (FXVPS.biz, WinnerVPS, AccuWebHosting) are commercially interested sources. The Market Watch CPU reduction figure of 20 to 40% is sourced from FXVPS.biz alone and has not been independently replicated. The OnTimer() CPU reduction from 80 to 90% to 30 to 50% is a single forum report.
MQL5 marketplace product descriptions are vendor-provided. The “70 symbols x 9 timeframes” performance claim from Amir Atif has not been independently benchmarked.