ICT methodology describes precise entry at institutional price levels, but the conversation stops at the chart. What happens between “price reaches the order block” and “fill confirmed” involves an execution chain that most ICT content ignores entirely. That chain adds 100 to 300 milliseconds on a colocated Forex VPS, or 250 to 800 milliseconds on a home PC. For a trend follower capturing 100 pips, 1 to 2 pips of execution degradation disappears into the margin. For an order block trader targeting 20 to 50 pips from a specific level, the same degradation costs 2 to 10% of the target.
This is not an article about how to identify order blocks or trade fair value gaps. That methodology is well-covered elsewhere. This article covers what no existing content addresses: how the execution infrastructure between your platform and your broker affects fill quality specifically for ICT-style precision entries, and where that infrastructure matters more (and less) than most traders assume.
The honest answer is nuanced. Many ICT traders use pre-positioned limit orders at OB/FVG boundaries, and limit orders are minimally latency-dependent because they sit server-side at the broker. For those traders, the VPS value proposition is about monitoring reliability and uptime, not execution speed. But for EA-driven market order entries during fast OB rejections, for scalping-style ICT on lower timeframes, and for the order management chain during rapid price movement, every millisecond in the execution chain translates to measurable fill degradation.
Sources include MQL5.com documentation, MetaQuotes developer statements, FXCM published execution data, academic research from Columbia, NYU, Oxford, and the Bank for International Settlements, MQL5 marketplace EA analysis, and MQL5 forum developer measurements. VPS provider data is cited where relevant and flagged as commercially interested.
The Execution Chain for an Order Block Entry
Two paths exist for entering a trade at an order block level, and their infrastructure sensitivity differs fundamentally.
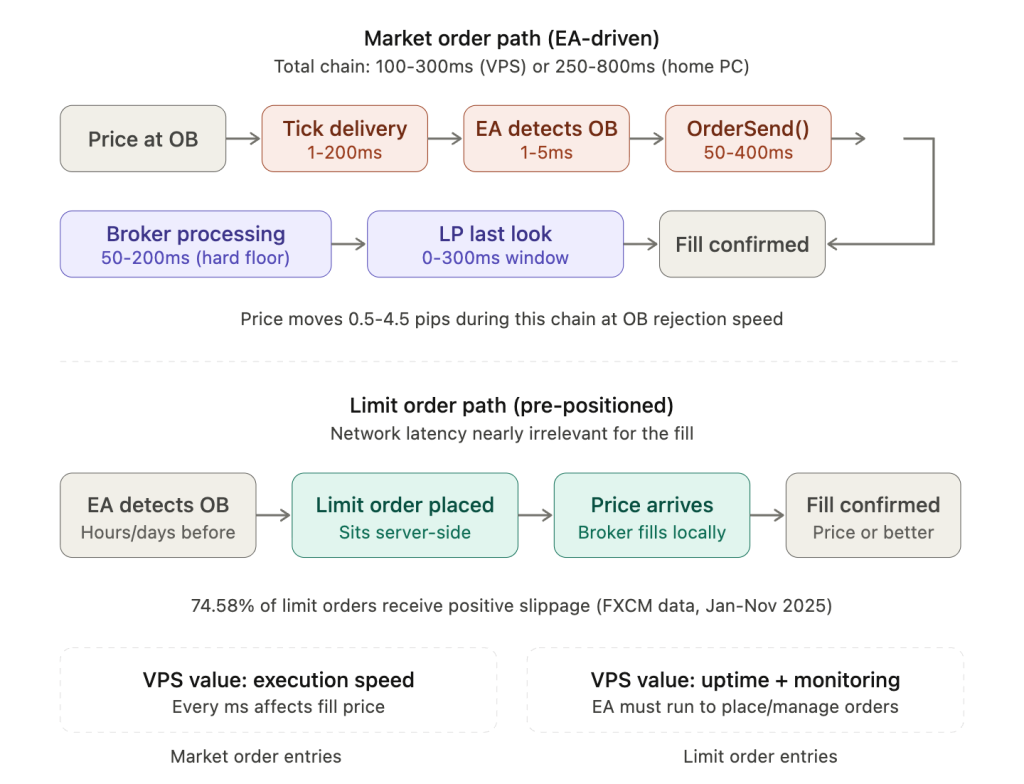
The first path is a pre-positioned limit order. The trader or EA identifies the order block on a higher timeframe, calculates the entry level, and places a limit order at the OB boundary before price arrives. That order sits server-side at the broker. When price reaches the level, the broker fills the order locally. Network latency between the trader’s terminal and the broker plays essentially no role in fill speed. The order is already there.
The second path is a real-time market order. Price approaches the OB level. The EA’s OnTick() fires when a new tick arrives. The EA detects the signal, calls OrderSend(), and the order travels across the network to the broker, through the broker’s internal processing, potentially through a liquidity provider’s last look window, and back. Every component in that chain adds delay, and during a fast OB rejection, price is moving while the chain executes.
The timeline for an EA-driven market order entry breaks down into measurable components. Tick delivery from broker to terminal takes roughly 1 millisecond on a colocated VPS versus 50 to 200 milliseconds on a home PC with consumer internet. MT5 internal processing adds approximately 1 to 2 milliseconds. EA detection logic, depending on complexity, adds another 1 to 5 milliseconds. The OrderSend() network round-trip contributes 50 to 100 milliseconds on a VPS with sub-1ms ping, or 100 to 400 milliseconds from a home connection. Broker and liquidity provider processing, including any last look window, adds 50 to 200 milliseconds regardless of where the trader’s terminal sits.
The total chain runs roughly 100 to 300 milliseconds from a low-latency VPS, or 250 to 800 milliseconds from a home PC. On MT4, add approximately 50 milliseconds of internal processing overhead to either figure, because MT4’s order handling architecture is slower than MT5’s by a consistent margin documented across multiple MQL5 forum sources.
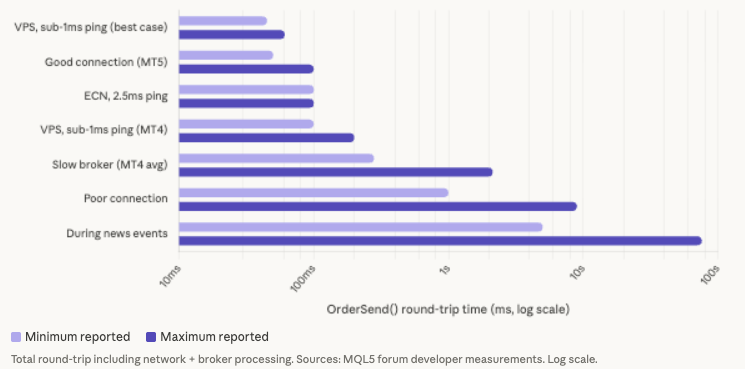
One finding from forum data deserves emphasis. Even with sub-1ms ping to the broker, OrderSend() execution still takes 45 to 61 milliseconds minimum in the best documented cases. The broker’s internal processing creates a hard floor that no amount of network optimization can eliminate. One experienced MQL5 forum developer summarized it directly: good values are roughly 60 to 200 milliseconds for a complete fill in MT5, and roughly 200 to 400 milliseconds in MT4. Order processing below 5 milliseconds is reserved for institutional participants with direct connections to liquidity providers, not MetaTrader users on any infrastructure.
This hard floor changes how traders should think about VPS investment for OB entries. The difference between a colocated VPS (1ms ping, roughly 60ms total execution) and a home PC (100ms ping, roughly 200ms total execution) is approximately 140 milliseconds. That 140 milliseconds matters, but the returns diminish sharply beyond colocation. Moving from a home PC to a same-city VPS captures most of the achievable improvement. Moving from a same-city VPS to cross-connected infrastructure in the same rack captures a smaller incremental gain.
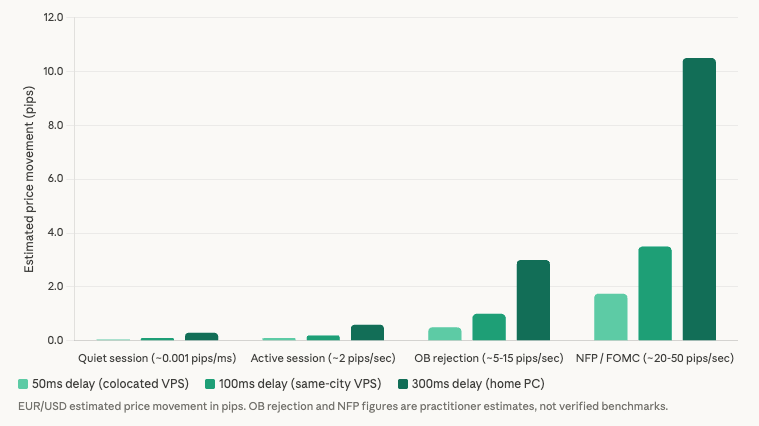
The proportional impact of that delay depends entirely on how fast price is moving at the moment of entry. During quiet market conditions, EUR/USD moves at roughly 0.001 pips per millisecond, making execution delay nearly irrelevant. During an active London/New York overlap session, the rate climbs to roughly 2 pips per second. During an order block rejection producing a fast V-shaped move, practitioner observations suggest 5 to 15 pips per second at peak burst rates, though no peer-reviewed source confirms exact pips-per-second measurements at OB rejection levels specifically. During major news events like NFP or FOMC, price can move 20 to 50 or more pips per second.
Translating those rates into execution delay impact: 100 milliseconds of additional latency during a quiet session costs roughly 0.1 pips. The same 100 milliseconds during an active session costs roughly 0.2 pips. During a fast OB rejection, that 100 milliseconds costs an estimated 0.5 to 1.5 pips. During NFP, it costs 2 to 5 pips. For an OB entry targeting 20 to 30 pips, the difference between a 100ms and 300ms total execution chain during a fast rejection is roughly 1 to 3 pips of additional slippage, or 3 to 15% of the trade’s target.
These burst-rate figures are estimated from practitioner observations and extrapolated from documented price movements, not from controlled measurement. The data gap is real: no published study has measured pips-per-second specifically at order block rejection levels. But the directional conclusion holds. Precision entries at specific price levels during fast moves are more infrastructure-sensitive than entries into trending markets where the exact fill price matters less.
Limit Orders vs Market Orders at OB Levels: The Honest Infrastructure Comparison
The infrastructure sensitivity of an ICT entry depends almost entirely on which order type executes at the level. This distinction matters more than VPS location, more than broker choice, and more than platform version. It is the single most important variable in determining whether execution speed affects your OB/FVG trading.
Limit orders placed at order block boundaries execute server-side at the broker. The order is already positioned before price arrives. When price reaches the level, the broker matches the order internally without waiting for a signal from the trader’s terminal. Network latency between the VPS and the broker is nearly irrelevant for the fill itself. FXCM published execution data covering January through November 2025 shows that 74.58% of limit and limit entry orders received positive slippage, meaning price improvement beyond the requested level. FXCM explicitly states that limit orders will only execute at the requested price or better and cannot receive negative slippage. FOREX.com confirms the same: limit orders fill at the requested price or better.
The tradeoff is fill certainty. During a fast OB rejection where price spikes through a level and reverses within seconds, a limit order sitting at the boundary may not fill at all. Price gaps past the level, the order remains unfilled, and the trade is missed entirely. The trader sacrifices execution certainty for price certainty. For ICT traders operating on higher timeframes where order blocks are identified hours or days in advance, this tradeoff is usually acceptable. The limit order sits patiently, fills cleanly if price reaches it, and the infrastructure question becomes irrelevant to execution quality.
Market orders at OB levels work in the opposite direction. The EA detects price reaching the zone and fires a market order that executes at the best available price immediately. Execution is guaranteed, but the fill price is not. FXCM data from the same period shows that 57.42% of stop and stop entry orders received negative slippage. Every millisecond of delay during a fast move means a worse fill. This is where VPS latency directly and measurably affects trade outcomes.
The critical finding from community research complicates the infrastructure argument: many ICT traders use limit orders as their primary entry method. The ICT methodology teaches placing limit orders at OB/FVG boundaries and waiting for price to arrive. Extensive searching across ForexFactory, Reddit, and MQL5 forums found essentially zero overlap between the ICT trading community and VPS/latency discussions. ICT traders focus on price action reading and patience. Execution infrastructure is treated as a given. This disconnect is partly rational, because limit orders genuinely reduce infrastructure dependency, and partly a blind spot, because the monitoring and order management chain still depends on platform uptime and connectivity.
MT5 offers an order type specifically suited to OB entries that MT4 cannot match. ORDER_TYPE_BUY_STOP_LIMIT places a conditional order that becomes a limit order only when a trigger price is reached. For an order block entry, the trader sets the trigger at the top of the OB zone and the limit price at the desired entry level within the zone. The order sits inactive until price actually enters the OB zone, then activates as a server-side limit order. This combines the benefits of conditional activation (no premature fill from random price action) with the price protection of a limit order. One MQL5 forum user described the practical use: “I use it to prevent slippage from a stop order. So I put on the limit value the same as stop value.” This order type is not available in MT4, which supports only Buy Limit, Sell Limit, Buy Stop, and Sell Stop. For ICT traders considering platform choice, this is a genuine infrastructure advantage that directly serves the methodology’s entry logic.
The infrastructure implications split cleanly along order type lines. For limit order entries, VPS latency matters primarily for the monitoring chain: the EA must be running to detect order blocks, calculate entry levels, place the limit order before price arrives, manage order expiry, and adapt to changing market structure as new OBs form and old ones are invalidated. The value of a VPS here is 24/7 uptime (99.99% availability translates to 52.6 minutes of downtime per year, compared to 263 to 876 hours per year for a home PC running at 90 to 97% compounded availability) rather than execution speed. For market order entries during fast rejections, VPS latency directly affects fill quality, and the execution chain analysis from the previous section applies in full.
The honest framing: if you trade ICT concepts manually using limit orders on daily or 4-hour order blocks, a VPS improves your uptime and remote access but will not meaningfully change your fill prices. If you run an EA that fires market orders when price reaches OB/FVG levels in real time, especially on lower timeframes during volatile sessions, VPS proximity to your broker’s execution infrastructure directly reduces slippage on every entry.
How Fast Do Order Block Rejections Actually Move?
The execution chain analysis above quantifies delay. This section quantifies what happens on the other side of the equation: how fast price moves at the moment an OB rejection occurs, and why that speed determines whether execution delay costs fractions of a pip or several pips.
No published quantitative study has measured the exact speed of price movement during order block rejections. This is a genuine data gap. The figures below are drawn from practitioner observations on ForexFactory and MQL5 forums, extrapolated from documented price movements during comparable market conditions. They should be treated as reference estimates, not verified benchmarks.
Order block rejections typically produce moves of 30 to 50 pips from the key level. The full rejection often completes within 1 to 5 one-minute candles, meaning the move plays out over roughly 1 to 5 minutes. But the initial rejection wick, the moment price touches the OB boundary and reverses, can form in seconds. That wick is the critical entry window. Practitioners on ForexFactory describe liquidity grabs completing within seconds, with the spike and reversal happening faster than most traders can react manually.
Several variables determine rejection speed. Session matters: London and New York overlap sessions produce faster rejections because higher liquidity and institutional participation create sharper directional moves. Asian session rejections tend to develop more slowly. Pair matters: major pairs like EUR/USD and GBP/USD generate faster rejections than crosses or exotics because of higher tick frequency. XAUUSD is notably fast and volatile, which explains why gold dominates the SMC/OB EA market on MQL5. News proximity matters: order blocks that sit near scheduled high-impact releases produce the fastest rejections. NFP and FOMC announcements can trigger near-instantaneous moves of 50 or more pips in under a second. Zone freshness matters: first-touch rejections from previously untested order blocks tend to be sharper and faster than rejections from levels that have been tested multiple times.
Tick frequency adds another layer to the problem. During London/New York overlap, EUR/USD on an ECN platform receives hundreds of ticks per second. During a quiet Asian session, the same pair might deliver 1 tick every few seconds. One MQL5 developer found that MetaTrader platforms can miss approximately 20% of ticks even with simple processing, and the miss rate increases during heavy activity. This means the EA may not even see the exact moment price touches the OB level. It sees the tick before and the tick after, with the actual rejection happening between observations. Faster tick delivery from a VPS with lower latency narrows this observation gap but cannot eliminate it entirely.
The liquidity grab scenario illustrates where infrastructure intersects with ICT methodology most directly. The ICT concept describes price briefly pushing through a level to trigger stop losses before reversing sharply. Stop-loss orders above or below the OB are triggered and filled at market, often with negative slippage. Institutional flow enters on the other side, causing a reversal that completes in milliseconds to seconds. An EA attempting to enter during that reversal faces the full execution chain delay. By the time a market order reaches the broker, price may already be several pips into the move.
This is where the infrastructure argument is strongest, but honesty requires noting that it is also where limit orders outperform market orders most clearly. A limit order pre-positioned at the reversal level fills cleanly during the liquidity grab without traversing the execution chain at all. The price spike triggers the fill server-side. The trader captures the entry that the market-order trader misses because of execution delay. For this specific scenario, order type selection matters more than VPS proximity.
The ForexVPS.net latency experiment provides the closest available empirical data on latency and slippage, though it was not designed for OB entries specifically. The experiment ran 120 trades on each of two VPS locations (London with sub-1ms ping and New York City with approximately 75ms ping to the same Switch Markets broker), trading GBP/JPY at 0.01 lots every 30 seconds. The London VPS recorded cumulative slippage of +0.20 pips across 120 trades, essentially zero net slippage with a slight positive average. The NYC VPS recorded -1.50 pips cumulative, consistent negative slippage. The total difference was 1.70 pips over 120 trades, roughly 0.014 pips per trade on average. The London VPS also showed a higher percentage of trades receiving positive or zero slippage. This experiment was published by a VPS provider with commercial interest and has not been independently replicated. The methodology is transparent (real accounts, documented setup), but the results should be cited with that caveat.
For OB/FVG entries specifically, the per-trade slippage difference would likely be larger than the 0.014 pip average, because the experiment fired trades at 30-second intervals regardless of market conditions, averaging across both calm and volatile moments. During the subset of trades that coincided with fast price movement, the per-trade difference would have been substantially greater. The experiment directionally supports the infrastructure argument but understates the impact for entries timed to fast-moving levels.
The Last Look Problem for Precision Entries
Beyond network latency and broker processing, a mechanism called last look adds a layer of execution uncertainty that most retail traders never see directly but experience through slippage and rejected orders. For ICT-style entries at order block levels during fast moves, last look amplifies the infrastructure problem in ways that are worth understanding even though the trader cannot directly control them.
Last look allows a liquidity provider to hold an incoming order for a brief window, typically 0 to 200 milliseconds or more, before deciding whether to fill it. During that window, the LP observes whether price has moved in a direction that would make the fill unprofitable. If price has moved against the LP, the order can be rejected or filled at a worse price. Academic research confirms this practice is pervasive in institutional foreign exchange. Álvaro Cartea and Sebastian Jaimungal at Oxford found that while last look can reduce quoted spreads, rejection rates can become so high that effective trading costs increase. Roel Oomen at the London School of Economics documented typical last look windows ranging from 0 to over 200 milliseconds, with some accounts reporting windows of 200 to 300 milliseconds.
The Global Foreign Exchange Committee report on last look found that rejection rates differed substantially across counterparties but did not appear to be a function of trade size or price volatility. Norway’s sovereign wealth fund (NBIM) found that venues with last look may not quote tighter spreads than venues without it, undermining the theoretical justification for the practice.
At the retail level, last look manifests differently depending on the broker’s execution mode. In Instant Execution mode, it appears as requotes: the broker rejects the order and offers a new price. In Market Execution mode, there are no requotes, but the broker or LP can still apply a delay before filling, and slippage replaces requotes as the mechanism for price adjustment. Some brokers add artificial delays to live orders, as documented by MQL5 forum users who measured inconsistencies between demo and live execution times.
For an OB entry during a fast rejection, last look creates a specific problem. Price reaches the order block and begins reversing. The EA detects the reversal and sends a market order. The order reaches the LP after traversing the network. The LP now holds the order for its last look window. During those 100 to 300 milliseconds, price is already moving away from the OB level as the rejection accelerates. The LP sees that filling the order at the requested price would be unprofitable because price has already moved. The fill either comes at a worse price or, in Instant Execution mode, gets rejected entirely and requires a re-entry attempt at a now-deteriorated price.
Lower network latency reduces this problem indirectly. The order reaches the LP faster, which means less price movement has occurred before the last look window begins. If the order arrives 100 milliseconds earlier, the LP’s observation window starts when price has moved less, making the fill more likely to occur at or near the requested price. This is one mechanism through which VPS proximity affects fill quality that most latency discussions overlook.
One critical finding from the research compounds the problem for EA developers. Most ECN, NDD, and STP brokers use Market Execution mode. In Market Execution mode, the slippage parameter in OrderSend() is completely ignored. Multiple experienced MQL5 forum developers have confirmed this. The parameter only functions in Instant Execution mode. This means OB/FVG EAs running on the most common retail ECN account types cannot programmatically limit slippage regardless of how they are coded. The broker fills at whatever price it determines is available after its internal processing and any last look window. The EA receives the fill confirmation and discovers the actual price only after the fact.
No-last-look execution venues exist. LMAX Exchange, which is FCA-regulated, operates as a no-last-look venue. EBS, Reuters Dealing, and CME futures also operate without last look. However, these venues are generally not accessible through standard MetaTrader retail broker accounts. The practical options for retail ICT traders are limited: choose a broker with documented low rejection rates and fast execution, use limit orders where possible to bypass the last look problem entirely (since limit orders execute at the requested price or better by definition), or accept that market order fills during fast moves will include some last look-induced slippage as a cost of doing business.
The infrastructure takeaway for OB/FVG traders is straightforward. Last look is a broker-side and LP-side mechanism that the trader cannot eliminate. But faster order delivery through lower network latency reduces the price movement that occurs before and during the last look window, improving the probability of a fill at or near the intended price. This benefit is most pronounced during fast OB rejections where price is moving rapidly, and least relevant for limit orders that bypass the last look mechanism altogether.
The MQL5 Ecosystem for OB/FVG Execution
The MQL5 marketplace provides a window into how the ICT/SMC trading community actually implements order block and fair value gap strategies in automated form. Examining the available products reveals a consistent pattern: sophisticated strategy logic paired with minimal attention to execution infrastructure.
A survey of the MQL5 marketplace found 15 auto-trading EAs specifically built for order block and FVG entries, plus 16 or more alert-only indicators for OB/FVG detection. The market is heavily weighted toward MT5. Most newer OB/FVG/SMC products are MT5-only, which aligns with the platform’s advantages for this use case: the stop-limit order type, faster internal processing, parallel trade contexts, and continued development investment from MetaQuotes.
Among the auto-trading EAs, most use standard market orders via OrderSend(). None mention OrderSendAsync() in their marketplace descriptions. Limit order support is rare. Only two products explicitly offer it: FVG EA Pro ($249, MT5), the most sophisticated product found, which supports limit orders, stop orders, and market orders with the trader choosing the execution method, and Order Block Scalping EA (paid, MT4), which explicitly uses limit orders placed at H4 order block levels when an engulfing candle closes. FVG EA Pro, developed by Haidar Lionel Haj Ali, carries a 4.59 out of 5 rating across 36 reviews and includes kill zone and Silver Bullet window trading. Its multi-order-type approach is the most execution-aware design in the marketplace.
No product in the marketplace explicitly discusses execution speed, latency optimization, or tick-level timing in its description. The focus is entirely on strategy logic: which order blocks to trade, which timeframes to scan, which confirmation signals to require. This confirms the disconnect identified in the community research. The ICT/SMC ecosystem treats execution as a solved problem while building increasingly complex entry logic on top of an execution layer that most developers never examine.
A few products acknowledge infrastructure tangentially. Order Block EA MT5 (free) explicitly recommends running the EA on a VPS with low latency and high availability, whether using MQL5 VPS or any reliable external provider. Easy SMC EA (free, MT5) notes that for optimal results, traders should use low spread ECN accounts with fast execution. Gold ICT OrderBlock Expert (free, MT5) waits for a confirmed retest of the OB before opening, which is an execution-aware design choice that reduces the need for speed by requiring confirmation rather than anticipating the touch. These are exceptions. Most products make no mention of execution environment.
XAUUSD dominates the marketplace for SMC/OB EAs. Most products are specifically optimized for gold, which makes sense given gold’s volatility and the sharp rejections it produces at institutional levels. Prop firm compatibility is a major selling point across products, reflecting the current market reality where many ICT traders manage challenge accounts that require consistent execution. Free products dominate the ecosystem, with a significant number of capable free EAs available alongside premium offerings.
Two findings from outside the marketplace deserve attention. The MQL5 Code Base contains a CExecutionSafety class that validates combined terminal ping and execution latency before allowing trade operations, returning false if a threshold is exceeded. A companion CLatencyMonitor class tracks inter-tick latency. These are infrastructure-aware library tools that any EA developer could integrate, but none of the marketplace OB/FVG products appear to use them. The tools exist. The ecosystem has not adopted them.
A freelance job listing for an Armani Gold EA explicitly required configurable slippage protection, retry logic that is limited and controlled, code written efficiently to minimize delay between signal confirmation and order placement, and optimization for fast execution on MT4/MT5 during volatile conditions, especially for XAUUSD. This listing demonstrates that developer awareness of execution issues for SMC-style EAs exists at the custom development level, even though it has not filtered into the mainstream marketplace products.
The MQL5 articles section reinforces the pattern. Tutorials on building FVG EAs and Smart Money Concept EAs cover strategy logic in detail but treat OrderSend() as a single function call without discussing execution timing, slippage handling, or latency measurement. An “Adaptive Smart Money Architecture” article combines OBs, FVGs, and break of structure in one adaptive EA without addressing execution infrastructure. The knowledge exists to build execution-aware ICT EAs, as the library tools and freelance specifications demonstrate. The marketplace and educational content simply have not connected these two domains.
For traders evaluating OB/FVG EAs, the practical takeaway is to check whether the EA supports limit order placement at identified levels rather than relying exclusively on market orders at the moment of detection. An EA that identifies an order block on H4 and places a limit order at the boundary in advance sidesteps most execution chain concerns. An EA that waits for price to reach the level and then fires a market order is fully exposed to every millisecond of the execution chain, and the marketplace offers almost no products that optimize for that scenario.
Measuring Execution Quality at OB/FVG Levels
Knowing that execution delay affects precision entries is useful. Measuring how much it affects your specific setup is actionable. Neither MT4 nor MT5 includes a built-in slippage measurement function, so traders and EA developers must implement measurement manually or use third-party tools.
The most direct method compares the requested price with the actual fill price after execution. In MT5, after OrderSend() completes, the actual fill price can be retrieved via HistoryDealGetDouble() using the deal ticket and the DEAL_PRICE property. Compare this to the price at the moment the EA decided to trade and the difference is your realized slippage in price units. For pending orders, OrderGetDouble(ORDER_PRICE_OPEN) returns the requested price, which can be compared against the deal price after execution to measure slippage on limit and stop orders separately.
Execution time measurement is straightforward. Call GetTickCount() immediately before OrderSend() and immediately after it returns. The difference in milliseconds represents the complete round-trip: network latency to the broker, broker processing, any last look window, and the return confirmation. Tracking this value across hundreds of trades reveals patterns that single measurements cannot. Execution times that spike during specific sessions, during news events, or on specific pairs indicate infrastructure bottlenecks or broker-side behavior that affects OB entry quality.
One MQL5 forum developer shared a logging approach that combines both measurements: the EA maintains a detailed transaction log showing recent ticks, the full MqlTradeRequest structure, the exact time the request was sent, the full MqlTradeResult returned by the broker, the round-trip latency, the current ping time, and the realized slippage. The developer noted that this level of logging helped keep brokers honest and in one case made it clear the broker was manipulating fills. For ICT traders running EAs at order block levels, this kind of logging is particularly valuable because it allows comparison of fill quality at different price levels, during different sessions, and at different market speeds.
The MQL5 marketplace includes a dedicated Slippage Calculator tool that automates part of this process. It calculates slippage in both points and account currency for all buy stop and sell stop orders used for entries and all stop loss orders used for exits. This covers market-order-equivalent execution (stops trigger at market) but does not measure limit order fills, which as discussed earlier typically receive zero or positive slippage.
The MQL5 signal service provides another data source. Each signal provider’s statistics include average slippage per broker and server pair, displayed as a value like “1.52 x 340,” meaning an average of 1.52 points of slippage across 340 copied trades. This data is useful for comparing brokers and server locations before committing to a setup, though it reflects copy-trade execution rather than direct EA execution and includes the additional latency of the signal copying infrastructure.
Myfxbook, despite being the most widely used trade analytics platform, does not track per-trade slippage for regular trading accounts. This has been a repeatedly requested feature that has never been implemented. Myfxbook only shows slippage data for its AutoTrade signal copying feature, not for standard trading. The platform provides win/loss ratios, drawdown analysis, average trade duration, hourly performance breakdowns, and currency pair analysis, but the one metric most relevant to execution quality at specific price levels is missing. Traders who need slippage tracking must implement it within their EA or use the MQL5 marketplace tools.
Formal A/B testing of VPS versus home PC execution quality is difficult to conduct properly. The test would require identical strategies running simultaneously on the same broker with the same liquidity conditions, which is nearly impossible to achieve because two orders from different locations hitting the same liquidity pool at the same moment affect each other’s fills. The ForexVPS.net experiment referenced earlier is the closest approximation found in any community, but it used 30-second intervals between trades rather than simultaneous execution, and it is commercially motivated. No independent, peer-reviewed A/B test of VPS versus home PC execution quality exists for retail forex.
The practical approach for ICT traders is to build slippage measurement into whatever EA runs the OB/FVG strategy. Log the intended entry price, the actual fill price, the execution time, and the market condition at the moment of entry. After several hundred trades, the data reveals whether execution quality degrades during fast moves, whether specific sessions produce worse fills, and whether the current infrastructure setup is costing measurable pips at OB levels. That data, specific to your broker, your VPS location, and your strategy, is worth more than any general benchmark.
VPS Placement for ICT-Style Entries
The proportional argument is the clearest way to frame VPS value for ICT traders, because it cuts through both the overselling and the dismissiveness that typically surround latency discussions.
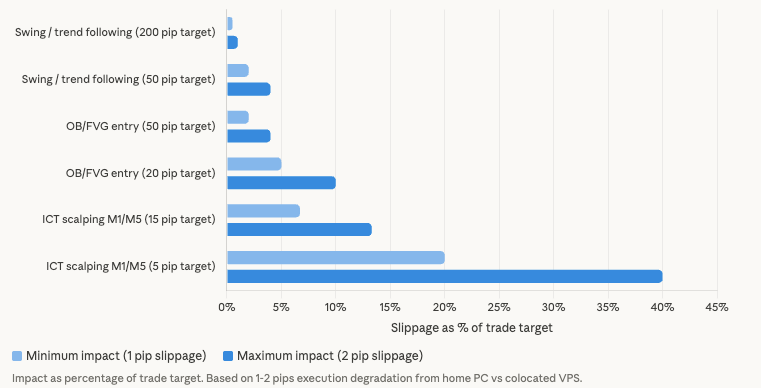
A trend-following strategy targeting 50 to 200 pips absorbs 1 to 2 pips of execution degradation at 0.5 to 4% of the trade’s target. A swing trader working weekly order blocks with 100-pip targets barely notices. At the other extreme, an HFT operation needs sub-millisecond execution that retail MetaTrader infrastructure cannot provide at any price, as covered in our HFT infrastructure gap analysis. ICT-style OB/FVG entries sit in the middle. A trader targeting 20 to 50 pips from a specific level loses 2 to 10% of the target to 1 to 2 pips of slippage. A scalping-style ICT entry on M1 or M5 targeting 5 to 15 pips loses 7 to 40%. This makes precision entry traders the population where VPS proximity produces measurable but not transformative improvement. Enough to justify the cost for active traders. Not enough to turn a losing strategy into a winning one.
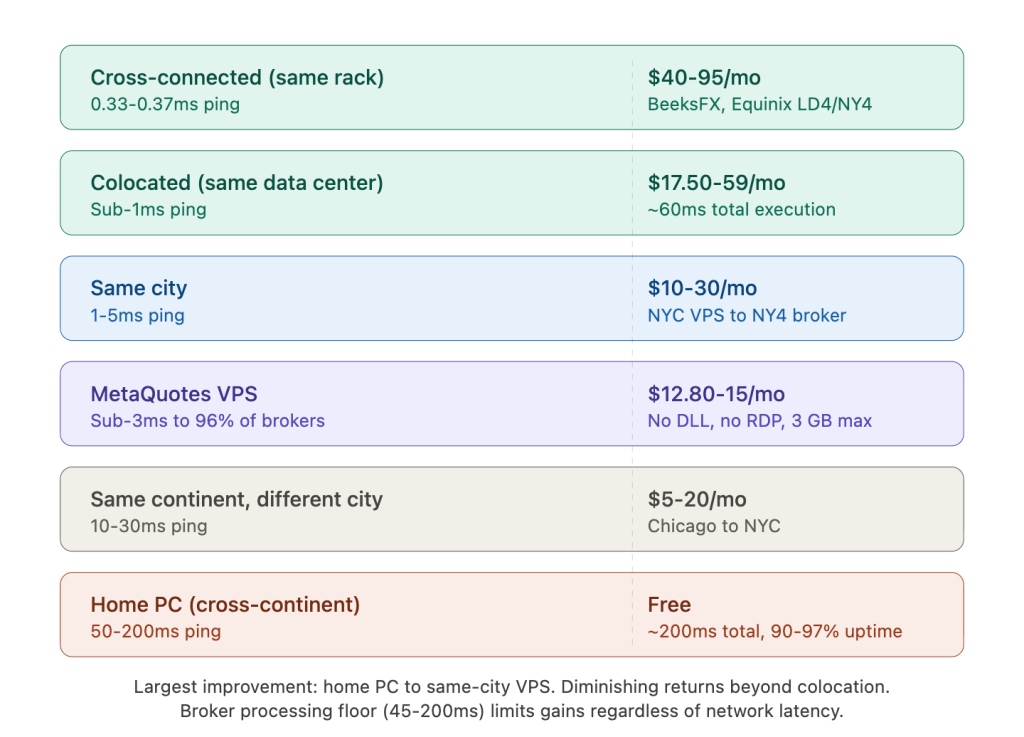
VPS proximity to the broker’s execution infrastructure determines how much of the achievable latency reduction the trader actually captures. The tiers break down predictably. Cross-connected infrastructure, meaning the VPS sits in the same rack or cage as the broker’s matching engine in facilities like Equinix LD4 or NY4, delivers 0.33 to 0.37 milliseconds of network latency. BeeksFX documents this tier at roughly $40 to $95 per month. Colocated infrastructure in the same data center but not the same rack delivers sub-1 millisecond latency at roughly $17.50 to $59 per month across providers. A same-city VPS, such as a New York VPS connecting to an NY4 broker, delivers 1 to 5 milliseconds at $10 to $30 per month. Same continent but different city, such as Chicago to New York, delivers 10 to 30 milliseconds at $5 to $20 per month. A home PC connecting cross-continent delivers 50 to 200 milliseconds at no additional infrastructure cost.
MetaQuotes’ own VPS service sits in a unique position at $12.80 to $15 per month. It achieves sub-3 millisecond latency to 96% of broker servers by running lightweight terminals across a distributed network. The limitations are significant for ICT EA traders: no DLL support, which breaks many custom EAs relying on external libraries, no strategy testing, one subscription per trading account, no Windows desktop access, and a maximum of 3 GB RAM. For a simple OB/FVG EA without DLL dependencies running on a single account, it offers excellent latency at low cost. For anything more complex, a full Windows VPS provides the flexibility the built-in service cannot.
Most STP and ECN forex brokers host their primary trading servers in Equinix NY4 (New York) or LD4 (London). Forum consensus across MQL5 and ForexFactory is consistent on this point. IC Markets operates from Equinix NY4. Pepperstone maintains servers in both London and New York Equinix facilities. Choosing a VPS in the wrong city relative to your broker’s actual server location can negate the latency advantage entirely. A London VPS connecting to a New York-hosted broker may produce 70 to 80 milliseconds of latency, worse than a budget New York VPS at 1 to 5 milliseconds. Confirming your broker’s server location before selecting a VPS region is the single most impactful infrastructure decision for execution quality.
ICT traders who use different brokers for different instruments face a placement compromise. A trader running one broker for gold and another for forex majors, with servers in different cities, cannot colocate with both from a single VPS. The options are a separate VPS colocated with each broker, which doubles the monthly cost but optimizes latency for both, a single VPS near the primary broker with acceptable but higher latency to the secondary, or MetaQuotes’ VPS service which maintains sub-3 millisecond access to most brokers regardless of location but carries the functional limitations noted above.
The hard floor problem applies to all tiers. Even with sub-1 millisecond ping, broker-side processing creates a minimum execution time of roughly 45 to 200 milliseconds. The difference between a colocated VPS at 1 millisecond ping and roughly 60 milliseconds total execution, versus a home PC at 100 milliseconds ping and roughly 200 milliseconds total execution, is approximately 140 milliseconds. That 140 milliseconds is meaningful during fast OB rejections where price moves 5 to 15 pips per second. But the diminishing returns are real. Moving from cross-continent to same-city captures the largest improvement. Moving from same-city to colocated captures a smaller gain. Moving from colocated to cross-connected captures a marginal gain that matters for high-volume operations but is difficult to justify for a trader placing a handful of OB entries per week.
For limit order ICT strategies, the VPS argument rests on uptime rather than speed. A home PC running at 90 to 97% compounded availability accumulates 263 to 876 hours of downtime per year. A VPS at 99.99% availability accumulates 52.6 minutes per year. For an EA that needs to monitor price structure continuously, detect new order blocks as they form, place limit orders before price arrives, manage order expiry, and adapt to invalidated levels, those hundreds of hours of potential downtime represent missed setups and unmanaged positions. The VPS does not make the limit order fill faster. It ensures the EA is running when the setup appears.
Several brokers offer sponsored VPS programs that reduce or eliminate the infrastructure cost. IC Markets provides a free VPS for traders generating 15 or more standard lots per month. IG offers free BeeksFX VPS access with a $2,000 minimum balance, otherwise $50 per month. FOREX.com waives VPS fees for MT5 traders with $500,000 or more in monthly volume. OANDA waives fees through its Elite Trader program at $10 million or more in monthly volume. For active ICT traders who already generate sufficient volume with their broker, the VPS cost may already be covered.
When Latency Matters and When It Doesn’t
The preceding sections build the technical case for how execution infrastructure affects ICT-style entries. This section draws the boundary lines. Overstating the infrastructure argument erodes the trust the rest of the article builds, and traders who invest in VPS infrastructure expecting it to fix execution problems that are actually broker-side or strategy-side will be disappointed.
VPS latency is nearly irrelevant in four common ICT scenarios. First, limit orders placed well in advance of price arrival. The order sits server-side. The fill happens locally at the broker. Whether the trader’s terminal is 1 millisecond or 200 milliseconds away changes nothing about fill quality. Many ICT traders operate exactly this way, identifying order blocks on daily or weekly charts and placing limit orders hours before price approaches. For these traders, VPS latency is a non-factor for execution.
Second, higher timeframe order blocks on daily and weekly charts. Price spends hours or days at these levels. The entry window is measured in candles, not milliseconds. Whether the order reaches the broker in 1 millisecond or 200 milliseconds is meaningless when the level remains valid for an entire session or longer.
Third, brokers using market maker execution with internal order matching. If the broker fills orders internally without routing to an external liquidity provider, the order does not traverse external networks beyond the initial hop to the broker. Low latency may not improve fills if the broker is pricing trades from its own book regardless of network speed.
Fourth, wide-target strategies. ICT swing traders working weekly order blocks with targets of 100 pips or more will not notice 1 to 2 pips of execution difference. The slippage falls within normal spread variation and does not meaningfully affect the trade’s risk-reward profile.
VPS latency genuinely matters in five scenarios. First, and most significantly, market orders fired by an EA when price reaches an OB or FVG level during a fast rejection. This is the primary use case for low-latency infrastructure in ICT trading. The EA detects the level, sends a market order, and every millisecond of delay during the fast move translates to a worse fill. The slippage is proportional to the speed of the rejection and the length of the execution chain.
Second, scalping-style ICT entries on M1 or M5 timeframes. Tight targets of 5 to 15 pips make 1 to 2 pips of execution degradation significant, consuming 7 to 40% of the trade’s expected value. These entries combine the speed sensitivity of scalping with the level-specific precision of ICT methodology.
Third, the monitoring and order management chain during fast price movement. Trailing stops in MetaTrader are client-side. They freeze when the terminal disconnects. Partial close operations, stop-loss adjustments, and take-profit modifications all require the terminal to send instructions to the broker. During a fast move away from an OB level, managing the position requires the same low-latency connection that entering the position does.
Fourth, EA-driven entries that react to real-time price action at the level rather than placing orders in advance. An EA that detects a change of character (CHoCH), break of structure (BOS), or liquidity sweep and then enters at the subsequent order block in real time is fully exposed to the execution chain. The detection, decision, and execution all happen within the fast-moving price action, making every component of the chain relevant.
Fifth, monitoring uptime for limit order lifecycle management. Even traders who use exclusively limit orders need their EA running to detect new order blocks as market structure evolves, place limit orders before price arrives, cancel or adjust orders when levels are invalidated by new price action, recreate orders that expire, and manage positions after fills. The EA cannot do any of this while offline. A home PC accumulating 263 to 876 hours of downtime per year represents missed setups, stale orders sitting at invalidated levels, and unmanaged positions after fills. The VPS value here is not speed. It is the difference between 52.6 minutes of annual downtime and hundreds of hours.
The overall framing: for most ICT traders who identify levels on H4 or higher timeframes and place limit orders in advance, a VPS improves uptime and remote access but does not meaningfully change fill prices. The infrastructure investment earns its return through reliability, not speed. For traders running EAs that fire market orders at OB/FVG levels in real time, particularly on lower timeframes and during volatile sessions, VPS proximity to the broker’s execution infrastructure directly reduces slippage on precision entries where every pip represents a larger percentage of the target than it would for a trend-following or swing-trading approach.
Neither framing is wrong. They describe different workflows within the same methodology. The infrastructure decision should follow from how the trader actually executes, not from a blanket assumption that faster is always better or that latency never matters for retail forex.
FAQ
Do ICT traders need a VPS if they use limit orders?
The fill itself does not benefit from lower latency because limit orders execute server-side at the broker. The VPS value for limit order traders is uptime and monitoring continuity. An EA that detects order blocks, places limits in advance, manages expiry, and adapts to invalidated levels needs to be running when setups form. A home PC at 90 to 97% availability accumulates 263 to 876 hours of downtime per year. At 99.99%, a VPS reduces that to 52.6 minutes. For traders who place limit orders manually without an EA, the VPS adds remote access and stability but does not change execution quality in any measurable way.
Which MetaTrader order type is best for order block entries?
It depends on whether you prioritize price certainty or fill certainty. A Buy Limit or Sell Limit placed at the OB boundary guarantees the requested price or better but may not fill during a fast gap-through. A market order guarantees execution but the fill price depends on latency and market speed. MT5 adds a third option that MT4 does not have: ORDER_TYPE_BUY_STOP_LIMIT, which activates a limit order only when a trigger price is reached. This is specifically useful for OB entries because it prevents premature fills from random price action before a genuine approach to the level. If your strategy tolerates occasional missed fills in exchange for consistently clean entry prices, limit orders are the stronger choice for most OB setups.
How much slippage should I expect on market orders at OB levels?
During quiet market conditions, slippage on a colocated VPS is typically under 0.3 pips on EUR/USD. During an active London/New York session, expect 0.2 to 0.6 pips. During a fast OB rejection with price moving at an estimated 5 to 15 pips per second, slippage can reach 0.5 to 4.5 pips depending on total execution chain length. During major news events, slippage of 2 to 15 pips is possible regardless of infrastructure. These figures are estimated from practitioner observations and documented price movement rates, not from controlled measurement at OB levels specifically. Your broker’s execution model, liquidity provider relationships, and whether last look is applied all affect the actual number. The only reliable way to know is to measure your own fills using the logging methods described in this article.
Does MT4 or MT5 execute faster for OB/FVG EA entries?
MT5 processes orders internally in approximately 1 to 2 milliseconds compared to roughly 50 milliseconds for MT4. Total OrderSend() round-trip times documented on MQL5 forums are roughly 60 to 200 milliseconds for MT5 and 200 to 400 milliseconds for MT4. MT5 also supports OrderSendAsync(), which allows the EA to continue processing while the order is in transit, and parallel trade contexts that let multiple EAs send orders simultaneously without the Error 146 queue that MT4 imposes. For a single EA trading one OB level, MT5’s faster internal processing provides a small but consistent advantage. For multi-EA setups where several strategies might react to the same liquidity grab, MT5’s architectural advantages are more significant.
Can I measure my broker’s execution quality at specific price levels?
Not with standard analytics tools. Myfxbook does not track per-trade slippage for regular accounts. The MQL5 marketplace includes a Slippage Calculator that measures slippage on stop and stop-entry orders, but the most effective approach is building measurement into your EA. Log the intended price, the actual fill price from HistoryDealGetDouble(), the round-trip time via GetTickCount(), and the market condition at the moment of entry. After several hundred fills, you can compare slippage at OB levels during fast moves versus calm conditions, and across different sessions, to determine whether your current infrastructure is costing measurable pips.
Is MetaQuotes’ built-in VPS good enough for ICT-style EAs?
At $12.80 to $15 per month, it delivers sub-3 millisecond latency to 96% of broker servers, which is competitive with or better than most third-party VPS options for pure network speed. The constraints are functional. No DLL support means any EA relying on external libraries will not run. No strategy testing means optimization must happen elsewhere. One subscription per trading account means multi-account setups require multiple subscriptions. No Windows desktop access means no RDP, no manual intervention, no secondary tools. The 3 GB RAM maximum is adequate for a single optimized terminal. For a simple OB/FVG EA without DLL dependencies on a single account, it is a cost-effective option with excellent latency. For anything involving DLL-based EAs, multiple accounts, or manual chart review alongside automation, a full Windows VPS is necessary.
References
- Moallemi, C. C. & Saglam, M. (2013). “The Cost of Latency in High-Frequency Trading.” Operations Research 61(5), pp. 1070-1086. Columbia University. Mathematically quantifies latency cost as comparable in magnitude to other trading costs (commissions, exchange fees). Calibrated with market data. Used in this article for the academic basis of the latency-slippage relationship. Source quality: peer-reviewed, top-tier journal.
- Hasbrouck, J. & Saar, G. (2013). “Low-latency trading.” Journal of Financial Markets 16, pp. 646-679. NYU Stern School of Business. Uses NASDAQ order-level data. Documents response peaks at 2 to 3 milliseconds for the fastest participants versus approximately 200 milliseconds for human reaction times. Used for context on institutional execution speed benchmarks. Source quality: peer-reviewed.
- Aquilina, M., Budish, E. & O’Neill, P. “Quantifying the high-frequency trading arms race.” BIS Working Paper No. 955, Bank for International Settlements. First study to use complete call-and-response exchange data. Analyzes latency arbitrage using FTSE 350 data and demonstrates measurable economic rents from speed advantages. Used for authoritative evidence that latency creates quantifiable execution costs. Source quality: central bank working paper.
- Cartea, Á. & Jaimungal, S. (2015/2019). Research on last look practices in FX markets. University of Oxford. Findings: last look reduces quoted spreads but creates rejection costs that can increase effective trading costs when rejection rates are high. Used in this article for the last look mechanism and its impact on precision entries. Source quality: peer-reviewed, institutional.
- Oomen, R. (2017). Research on last look execution in FX. London School of Economics. Documents typical last look windows at 0 to 200+ milliseconds, with some accounts reporting 200 to 300 milliseconds. Used for last look window duration estimates. Source quality: peer-reviewed.
- Global Foreign Exchange Committee (GFXC). Report on last look practices. Findings: rejection rates differ substantially across counterparties but do not appear to be a function of trade size or price volatility. Used for institutional evidence on last look behavior. Source quality: industry regulatory body.
- Norges Bank Investment Management (NBIM). Research on last look venues versus non-last-look venues. Finding: venues with last look may not quote tighter spreads than those without, undermining the theoretical justification for the practice. Used for the counterargument to last look spread reduction claims. Source quality: sovereign wealth fund research.
- FXCM. Published execution statistics, January through November 2025. Data: 74.58% of limit and limit entry orders received positive slippage; 57.42% of stop and stop entry orders received negative slippage. FXCM states limit orders cannot receive negative slippage. Used for the limit order versus market order slippage comparison. Source quality: broker-published, subject to FCA regulatory scrutiny.
- FOREX.com. Published execution policy documentation. Confirms limit orders fill at requested price or better. Used to corroborate FXCM limit order fill policy. Source quality: broker-published.
- MQL5.com Official Documentation. OrderSend() and OrderSendAsync() function references. ORDER_TYPE_BUY_STOP_LIMIT documentation. Fill policies (FOK, IOC, Return). HistoryDealGetDouble() and OrderGetDouble() for slippage measurement. iCustom() handle-based indicator sharing. IndicatorRelease() memory management. Automatic garbage collection behavior. Used throughout this article for MetaTrader execution mechanics. Source quality: primary platform documentation.
- MQL5.com Forum, Developer and Moderator Statements. Multiple threads cited for execution time measurements: VPS with sub-1ms ping showing 45 to 61 milliseconds minimum OrderSend() execution (forum thread 333221). Reported execution times ranging from 50 to 100 milliseconds on good connections to 1,000 to 8,978 milliseconds on poor connections, with news events producing delays up to 76 seconds (forum threads 145932, 7881, 399127, 282106, 333221). Forum expert summary: 60 to 200 milliseconds typical for MT5, 200 to 400 milliseconds for MT4. Slippage parameter confirmed as ignored in Market Execution mode by multiple experts. Developer confirmation that MT4 internal processing adds approximately 50 milliseconds compared to MT5 at 1 to 2 milliseconds. Tick miss rate of approximately 20% documented by one developer. Used throughout for practitioner-level execution data. Source quality: authentic developer experience, occasionally contradictory between sources.
- MQL5.com Forum, Limit Order and Order Type Discussions. Confirmation that pending orders including stops and take profits are server-side: “Once you place any pending orders, including stops and take profits, they are server side (broker), not client side.” Stop-limit order practical usage described by forum users. Used for the limit order infrastructure analysis. Source quality: practitioner forum, consistent across multiple posts.
- MQL5 Marketplace and Code Base. Survey of 15 auto-trading EAs and 16+ alert-only indicators for OB/FVG/SMC strategies. Product details: FVG EA Pro ($249, MT5, 4.59/5 rating, 36 reviews, developer Haidar Lionel Haj Ali), Order Block Scalping EA (MT4, limit order execution), Order Block EA MT5 (free, explicit VPS recommendation), Easy SMC EA (free, MT5, ECN recommendation), Gold ICT OrderBlock Expert (free, MT5, confirmed retest approach). CExecutionSafety class and CLatencyMonitor class in MQL5 Code Base. Freelance listing for Armani Gold EA with explicit execution optimization requirements. MQL5 articles on FVG EA development and Adaptive Smart Money Architecture. Slippage Calculator marketplace product (product ID 87571). Used for the ecosystem analysis section and measurement tools discussion. Source quality: primary marketplace data, product descriptions verified at time of research.
- ForexVPS.net Latency Experiment. Setup: two VPS locations (London sub-1ms ping, NYC approximately 75ms), Switch Markets broker, GBP/JPY, 120 trades each, 0.01 lot, trades every 30 seconds. Results: London VPS +0.20 pips cumulative slippage, NYC VPS -1.50 pips cumulative, total difference 1.70 pips over 120 trades (approximately 0.014 pips per trade). London VPS showed higher percentage of positive and zero slippage trades. This experiment was published by ForexVPS.net, a VPS provider with commercial interest in demonstrating latency benefits. It has not been independently replicated. Methodology is transparent (real accounts, documented setup). The directional finding aligns with broker execution data and academic research on latency costs. Used for the closest available empirical data on latency and slippage in retail forex.
- ForexFactory Forum. Practitioner observations on order block rejection speed: 30 to 50 pip moves completing within 1 to 5 M1 candles, initial rejection wicks forming in seconds, liquidity grabs completing within seconds. Latency testing data: Vultr UK VPS measurements to multiple brokers (ThinkMarkets 1.4ms, LMAX 2.13ms, Tickmill 2.15ms, Pepperstone 2.13ms, IC Markets 2.41ms). Slippage anecdotes: 36-pip slippage on GBP during news, 45-pip slippage on NZDUSD. Community consensus on limit orders receiving better fills than stop orders. Used for practitioner-level speed estimates and community evidence. Source quality: authentic trader experiences, not controlled measurements.
- Broker Server Locations and Sponsored VPS Programs. IC Markets: Equinix NY4, free VPS for 15+ standard lots per month. IG: free BeeksFX VPS with $2,000 minimum balance. FOREX.com: free VPS for MT5 traders with $500,000+ monthly volume. OANDA: VPS fees waived for Elite Trader program at $10 million+ monthly volume. Pepperstone: Equinix London and New York. BeeksFX cross-connection pricing documented at $40 to $95 per month. Forum consensus: most STP/ECN brokers host primary servers at Equinix NY4 or LD4. Used for VPS placement recommendations and cost analysis. Source quality: broker-published, verified at time of research. Pricing and program terms may change.
- MetaQuotes Built-in VPS Service. Pricing: $12.80 to $15 per month per trading account. Architecture: lightweight terminal without graphics, approximately 80 MT5 instances per Xeon E5-1650 / 128 GB server. Latency: sub-3 milliseconds to 96% of broker servers. Limitations: no DLL support, no strategy testing, one subscription per trading account, no Windows desktop access, 3 GB RAM maximum. Used for the MetaQuotes VPS evaluation in the context of ICT-style EA deployment. Source quality: MetaQuotes official documentation and pricing.
- VPS Provider Operational Data. MassiveGRID rule of thumb: “If the market is moving at 2 pips per second during news, 100ms of latency equals approximately 0.2 pips of slippage.” This figure is from a commercially interested source and is used in this article only for directional validation. Cross-article VPS tier capacity data from ForexVPS.net, AccuWebHosting, MassiveGRID, WinnerVPS, and FXVM used for context on VPS proximity tiers and cost ranges. All VPS provider data is flagged as commercially interested where cited.
- Myfxbook Platform Limitations. Myfxbook does not track per-trade slippage for regular trading accounts. This feature has been repeatedly requested by users but has not been implemented. Slippage tracking is available only for the AutoTrade signal copying feature. Documented through user requests and platform feature analysis. Used for the measurement limitations discussion. Source quality: platform feature verification.
Editorial Note
This article examines how execution infrastructure affects fill quality for ICT-style precision entries at order block and fair value gap levels. It covers the execution chain for market and limit orders, last look mechanics, the MQL5 EA ecosystem, execution measurement methods, and VPS placement considerations. It does not constitute financial advice, trading strategy recommendations, or endorsement of any specific EA, broker, or execution approach.
The distinction between order types is central to the infrastructure argument. Limit orders placed in advance execute server-side and are minimally latency-dependent. Market orders fired during fast moves are fully exposed to the execution chain. The article presents both paths honestly because the right infrastructure decision depends on which order type the trader actually uses, not on a blanket assumption about latency.
Execution time figures are drawn from MQL5 forum developer measurements across multiple threads and time periods. These represent practitioner-reported data, not controlled laboratory measurements. Actual execution times vary by broker, liquidity provider, account type, execution mode, platform version, and market conditions at the moment of the order. Figures should be treated as reference ranges for infrastructure planning, not guaranteed specifications.
Price movement rates during order block rejections are estimated from practitioner observations on ForexFactory and MQL5 forums. No peer-reviewed study has measured pips-per-second specifically at order block rejection levels. This data gap is flagged throughout the article. The estimates are directionally consistent with documented price behavior during comparable market conditions but should not be cited as verified benchmarks.
The ForexVPS.net latency experiment is cited as the closest available empirical data on latency and retail forex slippage. It was published by a VPS provider with commercial interest in demonstrating latency benefits. It has not been independently replicated. The methodology is transparent, but the results should be weighed with that context.
Academic research on latency costs, last look practices, and market microstructure (Moallemi & Saglam, Hasbrouck & Saar, Cartea & Jaimungal, Oomen, BIS Working Paper 955) studies institutional execution on equity exchanges and institutional FX, not retail forex via MetaTrader. The principles apply directionally, meaning faster execution generally produces better fills, but the specific magnitudes differ. Retail forex via MT4 and MT5 faces a hard floor of approximately 45 to 200 milliseconds of execution time regardless of network latency because broker-side processing dominates.
FXCM execution statistics cover January through November 2025 and are self-reported by a regulated broker. FOREX.com execution policy is broker-published. Both are cited for the limit order versus market order slippage comparison and are subject to the accuracy standards of their respective regulatory environments.
MQL5 marketplace product details, ratings, and pricing were verified at the time of research and may change. Product descriptions and developer claims are reported as found. No independent testing of marketplace EAs was conducted for this article.
This article is published on vpsforextrader.com, a VPS hosting provider. The infrastructure analysis applies the same evaluation framework regardless of which VPS provider the reader chooses. No specific VPS provider is recommended in the editorial content. The reader is on a VPS provider’s website and should factor that context into their assessment of the infrastructure argument presented here.